HOT TOPICS LIST
- MACD
- Fibonacci
- RSI
- Gann
- ADXR
- Stochastics
- Volume
- Triangles
- Futures
- Cycles
- Volatility
- ZIGZAG
- MESA
- Retracement
- Aroon
INDICATORS LIST
LIST OF TOPICS
PRINT THIS ARTICLE
by Koos van der Merwe
"Starbucks is undervalued and underpriced." So said Howard Schultz on Friday, June 22.
Position: Accumulate
Koos van der Merwe
Has been a technical analyst since 1969, and has worked as a futures and options trader with First Financial Futures in Johannesburg, South Africa.
PRINT THIS ARTICLE
TECHNICAL ANALYSIS
Starbucks
07/09/18 11:53:52 AMby Koos van der Merwe
"Starbucks is undervalued and underpriced." So said Howard Schultz on Friday, June 22.
Position: Accumulate
| Starbucks Corporation is an American coffee company and coffeehouse chain. Starbucks was founded in Seattle, Washington in 1971. As of 2018, the company operates 28,218 locations worldwide. It is highly unlikely that there is somebody in America that has never visited a Starbucks, whether to buy a coffee or a Caramel Macchiato, my favorite drink. However, in spite of always being full of buyers, the share price has fallen strongly probably because of problems they have recently had where certain Starbucks have had racial bias. On June 19, 2018, the company announced a set of strategic priorities and corresponding operational initiatives to accelerate growth and create long term shareholder value. So, is the share of the company now a buy? |

|
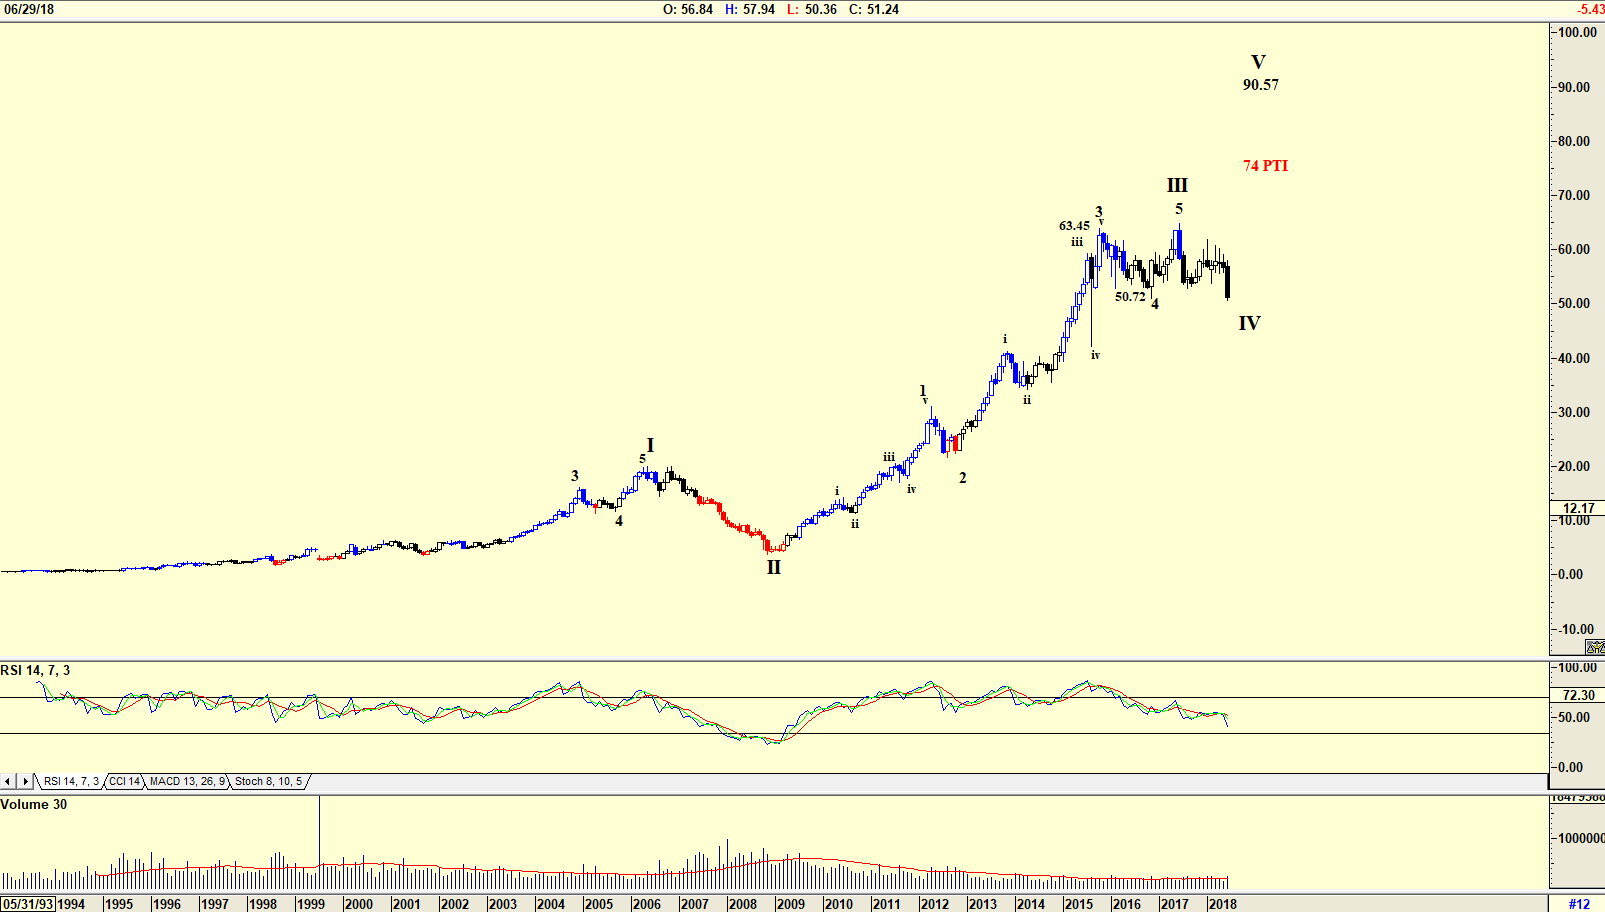
| Figure 1. Monthly chart of Starbucks. |
| Graphic provided by: AdvancedGET. |
| |
| The chart in Figure 1 is a monthly chart with an Elliott wave count suggesting that the share price is in a WAVE IV. The RSI indicator suggests that there is still some downside before a recovery into a WAVE V. A wave 4 usually bottoms with the 4th Wave of lesser degree, and with the price presently within that price range the share price could start rising. The PTI (Probability Index) shown on the chart suggests that the probability of the share rising to $90.57 is at 74%, which is high. Do note that with the candlestick black it could turn red suggesting further weakness before rising once again in black and then changing to blue, suggesting strength. The change in candlestick color is an Advanced GET indicator known as Expert Trend Locator. |

|
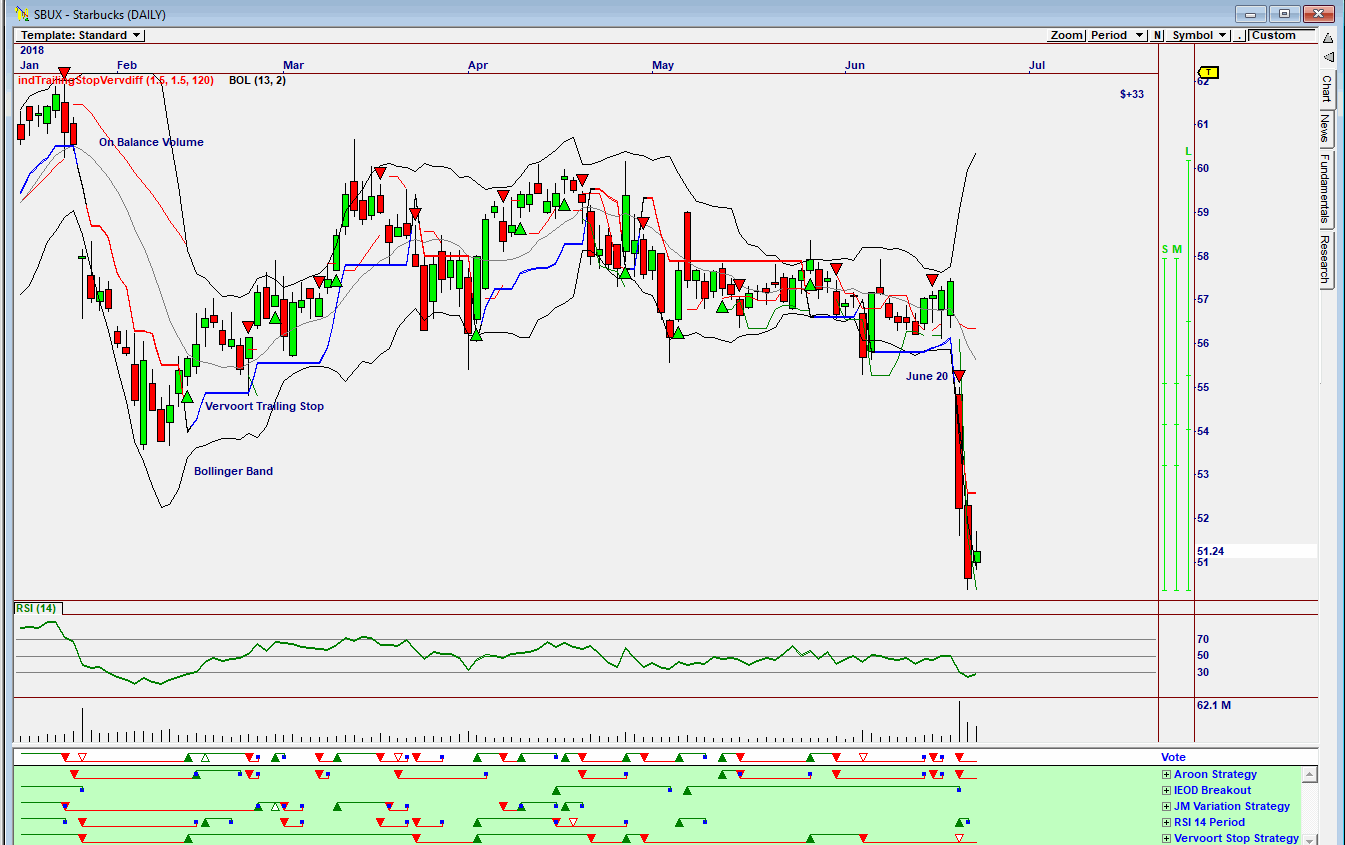
| Figure 2. Omnitrader daily chart. |
| Graphic provided by: Omnitrader. |
| |
| The chart in Figure 2 is a daily Omnitrader chart with the Vote line showing a sell signal given on June 20, based on the Aroon and Vervoort Stop Strategies. The chart shows how the share started to move up after Howard Schultz made his statement on Friday the 22nd. The RSI indicator is also at oversold levels and starting to move up. A buy will be suggested when it breaks above the 30 horizontal. Do note that volume was high when the share price fell on June 20 and although the share price started to recover on June 22, volume, although above average, was still lower as the price fell. Howard Schultz's statement may have stopped the fall of the share price, but a strong rise, although possible on a daily chart, is not suggested on the monthly chart. One should therefore accumulate shares slowly and only on every correction. |
Has been a technical analyst since 1969, and has worked as a futures and options trader with First Financial Futures in Johannesburg, South Africa.
| Address: | 3256 West 24th Ave |
| Vancouver, BC | |
| Phone # for sales: | 6042634214 |
| E-mail address: | petroosp@gmail.com |
Click here for more information about our publications!
Comments
Date: 07/28/18Rank: 3Comment:

Request Information From Our Sponsors
- StockCharts.com, Inc.
- Candle Patterns
- Candlestick Charting Explained
- Intermarket Technical Analysis
- John Murphy on Chart Analysis
- John Murphy's Chart Pattern Recognition
- John Murphy's Market Message
- MurphyExplainsMarketAnalysis-Intermarket Analysis
- MurphyExplainsMarketAnalysis-Visual Analysis
- StockCharts.com
- Technical Analysis of the Financial Markets
- The Visual Investor
- VectorVest, Inc.
- Executive Premier Workshop
- One-Day Options Course
- OptionsPro
- Retirement Income Workshop
- Sure-Fire Trading Systems (VectorVest, Inc.)
- Trading as a Business Workshop
- VectorVest 7 EOD
- VectorVest 7 RealTime/IntraDay
- VectorVest AutoTester
- VectorVest Educational Services
- VectorVest OnLine
- VectorVest Options Analyzer
- VectorVest ProGraphics v6.0
- VectorVest ProTrader 7
- VectorVest RealTime Derby Tool
- VectorVest Simulator
- VectorVest Variator
- VectorVest Watchdog
