HOT TOPICS LIST
- MACD
- Fibonacci
- RSI
- Gann
- ADXR
- Stochastics
- Volume
- Triangles
- Futures
- Cycles
- Volatility
- ZIGZAG
- MESA
- Retracement
- Aroon
INDICATORS LIST
LIST OF TOPICS
PRINT THIS ARTICLE
by Koos van der Merwe
With all the uncertainty over the past few weeks, where does one put one's money?
Position: Buy
Koos van der Merwe
Has been a technical analyst since 1969, and has worked as a futures and options trader with First Financial Futures in Johannesburg, South Africa.
PRINT THIS ARTICLE
TECHNICAL ANALYSIS
What Now Brown Cow?
06/28/18 03:30:50 PMby Koos van der Merwe
With all the uncertainty over the past few weeks, where does one put one's money?
Position: Buy
| The past few weeks have been very uncertain. With financial markets falling because of a possible trade war between the United States and China; with President Trump insulting the Prime Minister of Canada, a country that has been America's best ally, and finally with the uncertainty of who the winner is between President Trump and Kim Jong-un, the Supreme Leader of North Korea. The question on everyone's mind is what for the future of the stock market? More and more "experts" are suggesting that a market crash is just around the corner, so "What Now Brown Cow?" Looking for a program that effectively analyze the market is a must, as day trading, rather than long term investing, is becoming more and more viable. Weekly option trading is capturing more and more attention especially with the Warren Buffet strategy of selling a Put on a stock he would like to own. However, for those investors who "Buy and Hold", choosing a stock with fundamentals is the way to go, but keeping an eye on technical analysis for short term trading is becoming a must. |

|
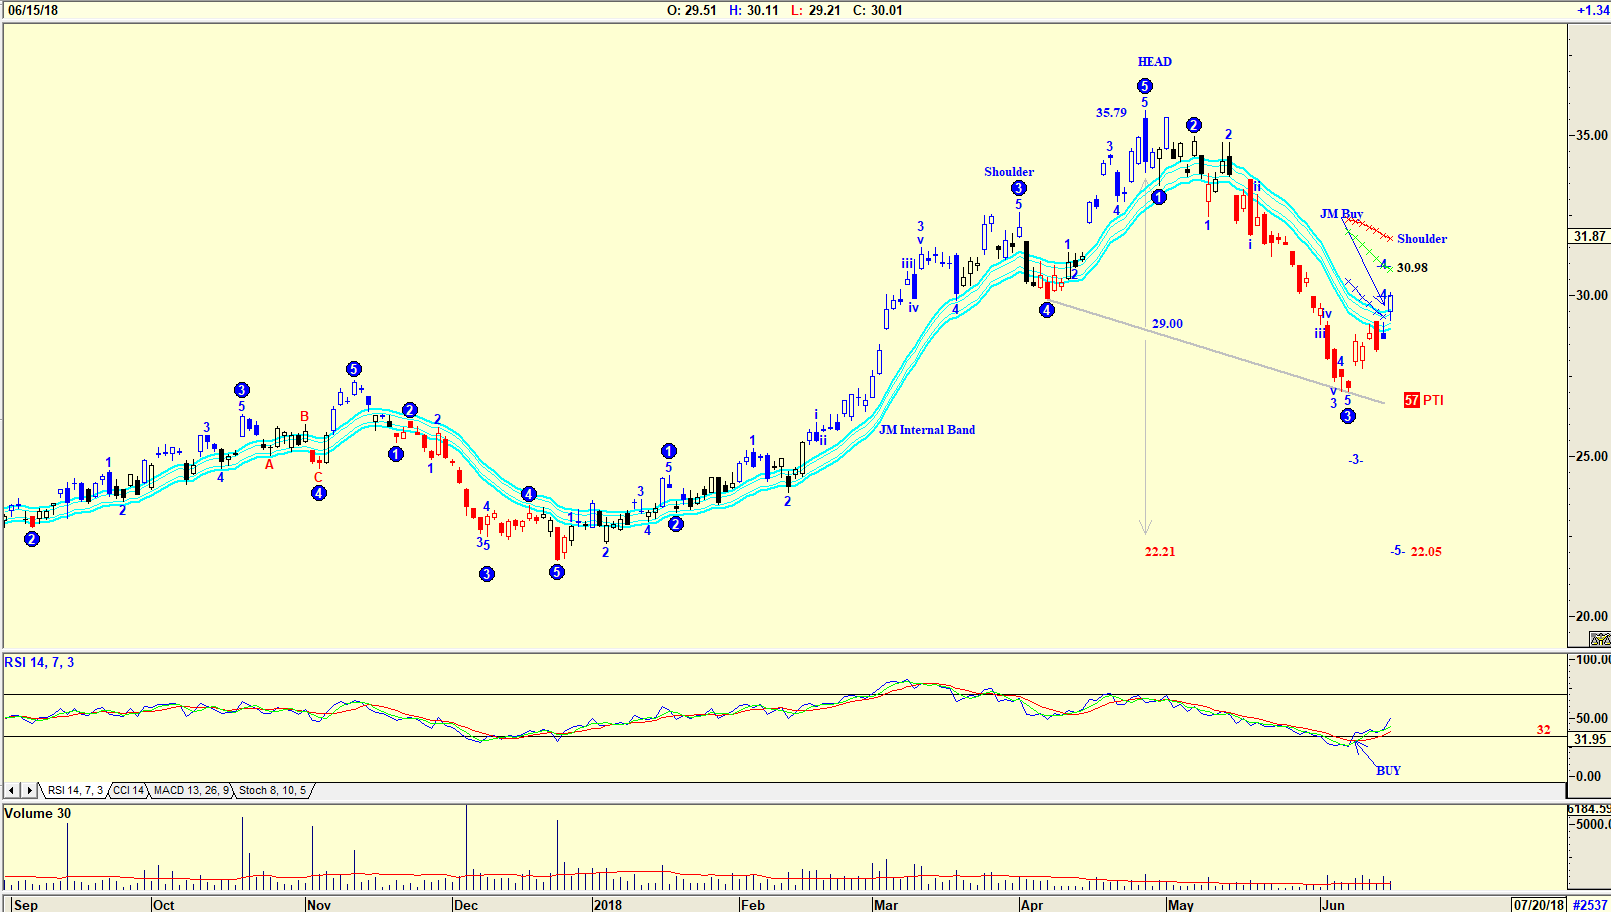
| Figure 1. Advanced GET chart of NIB. |
| Graphic provided by: AdvancedGET. |
| |
| The daily chart of the share iPath Bloomberg Cocoa Trust (NIB) is an Advanced GET chart with an Elliott wave count suggesting that the share is in a WAVE 4 uptrend with a possible target of $30.98. The PTI (probability Index) at 57 is suggesting that there is a 57% chance that the share price could fall to $22.05. The chart pattern also looks like a possible head and shoulder formation suggesting that the share price could fall to $22.21. The share price at the closing of Friday, June 15, gave a JM internal band buy. The JM internal band is a 15-period simple moving average offset by 2% positive and 2% negative. A move above the upper band suggests a buy and below the lower band, a sell. Finally, do note the RSI index which has suggested a buy by rising above the 32-horizontal. |

|
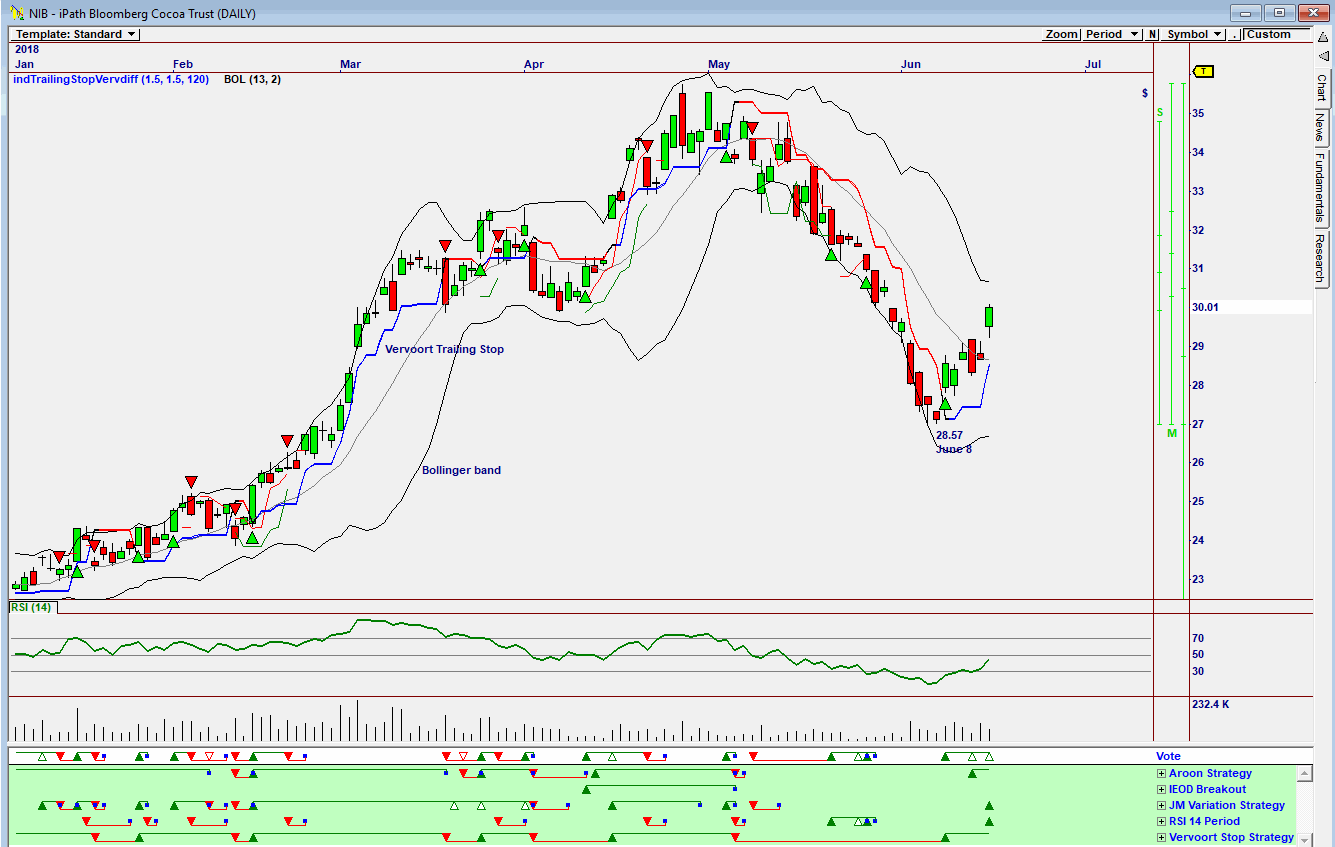
| Figure 2. Omnitrader chart of NIB. |
| Graphic provided by: Omnitrader. |
| |
| Figure 2 is an Omnitrader daily chart of the iPath Bloomberg Cocoa Trust (NIB). The chart shows that a buy signal was given by the Vote line on June 8 when the price was $28.57, based on the Vervoort Stop Strategy shown in Green below the Vote line. |

|
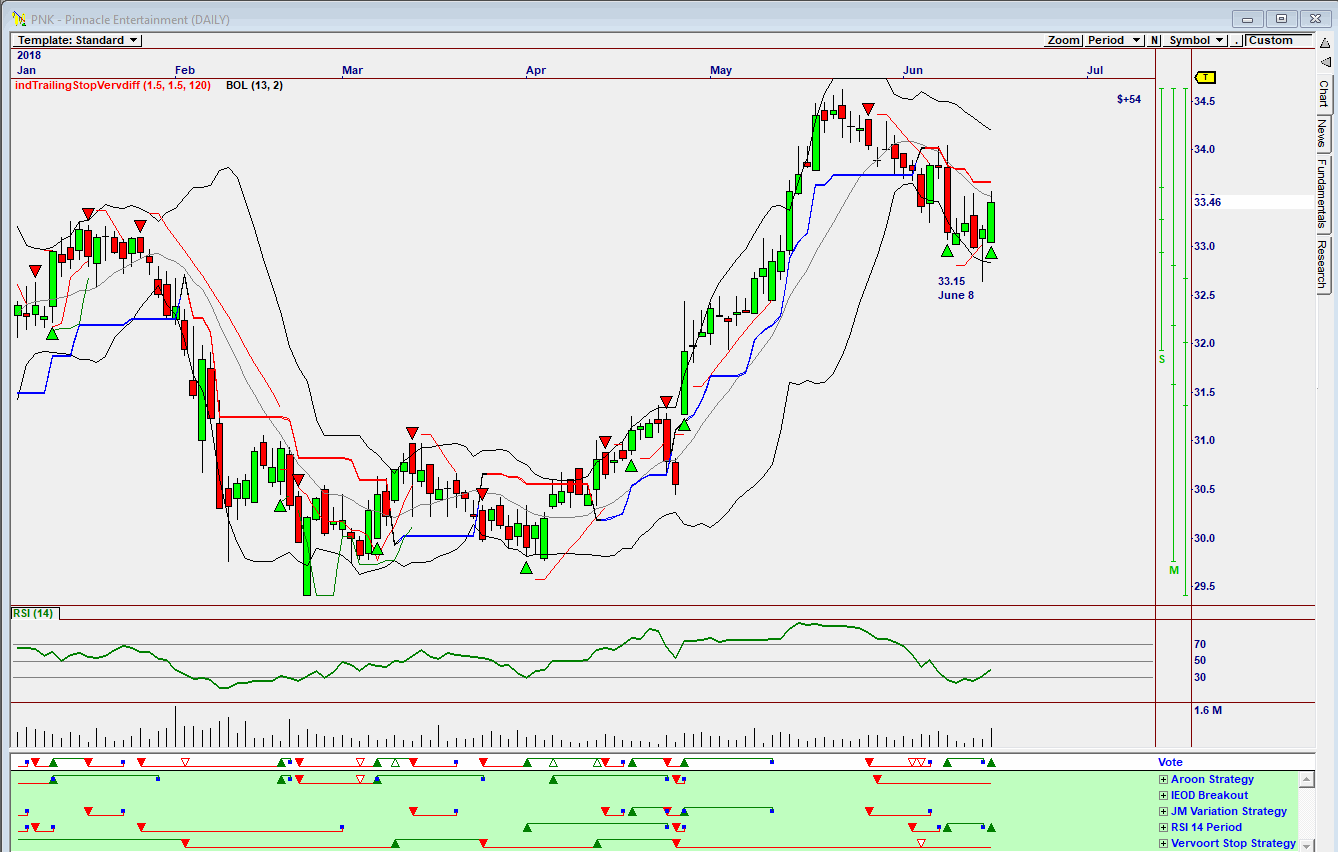
| Figure 3. Omnitrader chart of Pinnacle Entertainment. |
| Graphic provided by: Omnitrader. |
| |
| Looking at Omnitrader analysis for further buy signals based on Friday, June 15, another share that gave a buy is Pinnacle Entertainment (PNK) The share price gave a buy on the Vote line based on the RSI 14-period strategy. Studying the Omnitrader program with the strategies I have researched over the years, based on the end of day for Friday the 15th, other stocks triggered for further investigation are Fortris (FTS-T), JM Smucker (SJM), Quarterhill (QTRH-T), North American Palladium (PDL-T), Blackrock Float Rate (FRA), Boralex (BLX-T) and, finally, Retrophin Inc (RTR-T). I must say that I find it interesting that more Canadian Stocks suggested buys than US stocks. All the stocks suggested are further analyzed with Advanced GET suggesting possible targets. So, "Here we are brown cow.' |
Has been a technical analyst since 1969, and has worked as a futures and options trader with First Financial Futures in Johannesburg, South Africa.
| Address: | 3256 West 24th Ave |
| Vancouver, BC | |
| Phone # for sales: | 6042634214 |
| E-mail address: | petroosp@gmail.com |
Click here for more information about our publications!
PRINT THIS ARTICLE

Request Information From Our Sponsors
- StockCharts.com, Inc.
- Candle Patterns
- Candlestick Charting Explained
- Intermarket Technical Analysis
- John Murphy on Chart Analysis
- John Murphy's Chart Pattern Recognition
- John Murphy's Market Message
- MurphyExplainsMarketAnalysis-Intermarket Analysis
- MurphyExplainsMarketAnalysis-Visual Analysis
- StockCharts.com
- Technical Analysis of the Financial Markets
- The Visual Investor
- VectorVest, Inc.
- Executive Premier Workshop
- One-Day Options Course
- OptionsPro
- Retirement Income Workshop
- Sure-Fire Trading Systems (VectorVest, Inc.)
- Trading as a Business Workshop
- VectorVest 7 EOD
- VectorVest 7 RealTime/IntraDay
- VectorVest AutoTester
- VectorVest Educational Services
- VectorVest OnLine
- VectorVest Options Analyzer
- VectorVest ProGraphics v6.0
- VectorVest ProTrader 7
- VectorVest RealTime Derby Tool
- VectorVest Simulator
- VectorVest Variator
- VectorVest Watchdog
