

HOT TOPICS LIST
- MACD
- Fibonacci
- RSI
- Gann
- ADXR
- Stochastics
- Volume
- Triangles
- Futures
- Cycles
- Volatility
- ZIGZAG
- MESA
- Retracement
- Aroon
INDICATORS LIST
LIST OF TOPICS
PRINT THIS ARTICLE
by Mark Rivest
See why this gaming stock could soon have a significant decline.
Position: Sell
Mark Rivest
Independent investment advisor, trader and writer. He has written articles for Technical Analysis of Stocks & Commodities, Traders.com Advantage,Futuresmag.com and, Finance Magnates. Author of website Four Dimension Trading.
PRINT THIS ARTICLE
STOCKS
Is MGM Resorts International A Bad Bet?
06/21/18 04:45:56 PMby Mark Rivest
See why this gaming stock could soon have a significant decline.
Position: Sell
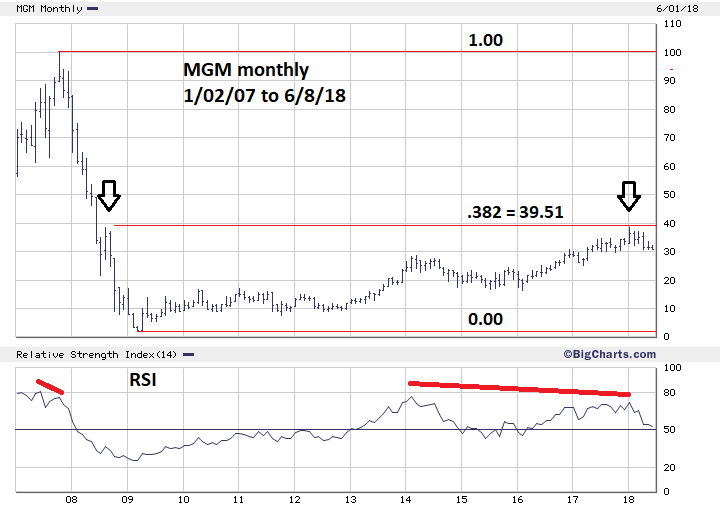
| MGM Resorts International (MGM), is a global hospitality company, operating a portfolio of destination resort brands, including Bellagio, MGM Grand, Mandalay Bay and The Mirage. The Company's resorts offer gaming, hotel, dining, entertainment, retail, and other resort amenities. The stock hit its all - time high of 100.50 in October 2007 and in just sixteen months plunged to 1.81, a staggering 98%! It took nearly nine years for the stock to climb back to 38.41, yet now appears to have begun a down turn that could wipe out 50% of its value. Long-term Picture There are many ways to discover a stock's support and resistance. One method that's been used for decades is Fibonacci retracement analysis. A Fibonacci retracement is created by taking two extreme points on a stock chart and dividing the vertical distance by the key Fibonacci ratios of 23.6%, 38.2%, 50%, 61.8% and 100%. Having two or more Fibonacci ratio coordinates in a tight cluster increases the chances a support/resistance could hold. The monthly MGM chart illustrates the incredible 98.69-point drop — this is the range to discover the primary Fibonacci coordinate. The .382 retracement level is 39.51, very close to the 2018 high at 38.41. The next step is to discover if there's a second Fibonacci coordinate. Note that during the massive 2007-2009 decline the largest rally occurred from July to August 2008. MGM went from 21.65 to 38.49 an amazing 77% rally in just one month! Now look at January 2018, the high point of an eight year and ten month rally was at 38.41 — only eight cents away from a perfect 100% retracement to the August 2008 high! The tight cluster of Fibonacci coordinates at 39.51 and 38.49 represent a powerful resistance zone that could hold for several months, possibly years. Also note the significant bearish divergence on the monthly RSI momentum indicator between the peak made in March 2014 and January 2018. A security is considered in the overbought zone when the RSI is above 70%. In early 2014 the monthly RSI reached 77%. In early 2018 with MGM trading about ten points higher than it was in early 2014, the Monthly RSI only reached 71%. A higher price with a lower RSI reading means that MGM's momentum is decreasing. That the divergence happened while in the overbought zone increases the potency of the signal. |
|
| Figure 1. The .382 retracement level is 39.51, very close to the 2018 high at 38.41. |
| Graphic provided by: BigCharts.com. |
| |
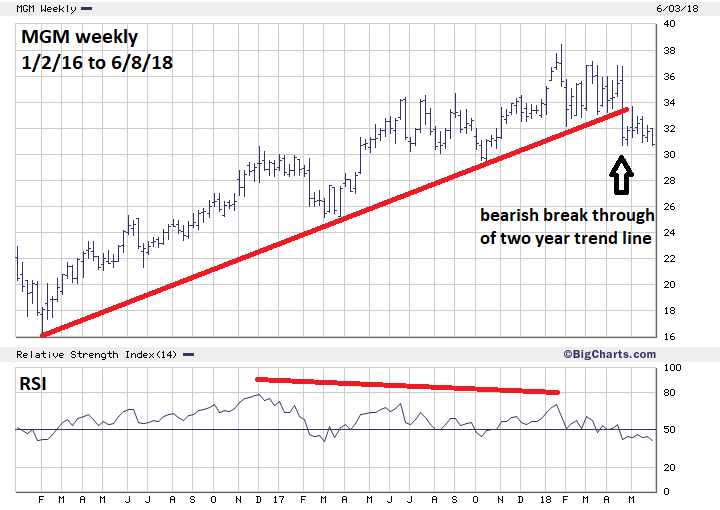
| Intermediate-term Picture Trendlines are an important tool for trend identification and confirmation, they connect two or more points defining support/resistance. The weekly chart shows several times, from 2017 to early 2018, the line provided support. Then on April 26, 2018, MGM decisively broke below the trendline. Another important event happened on April 26, MGM's performance was much weaker than the broader stock market. You want to buy stocks that can match or outperform the broader market. Stronger than average stocks tend to hold their value better when the broader market turns down and provide superior returns when the market rises. MGM made its last significant bottom on February 9, 2016 just two days before the S&P 500 (SPX) made its last significant bottom. For nearly two years MGM closely matched SPX's movements. On January 26, 2018 SPX hit its nearly two-year rally high. On January 29 MGM had its rally high. Both then had a sharp drop and bottomed on February 9. However, on April 26 MGM broke below both its trendline and the February 9 bottom. The SPX held decisively above its February 9 bottom. Note the weekly RSI is also showing a bearish divergence. RSI was at 78% at MGM's December 2016 top and only recorded a 70% reading at the January 2018 peak. |
|
| Figure 2. On April 26, 2018, MGM decisively broke below the trend line. |
| Graphic provided by: BigCharts.com. |
| |
| Other Factors MGM's dividend yield is a meager 1.5% so there's little chance the stock could be bought for income, and costs are low for short sellers paying the dividend. Short interest as a percentage of the stock's float is only 4.8% and the short interest ratio - days to cover shorts is 2.1 days. MGM currently has very little fuel for a short covering rally. |
| Summary Turning down after hitting a major resistance zone, breaking below a two-year trendline, and underperforming the broader market is powerful evidence that a stock could be heading significantly lower. Is it a certainty? No, there aren't certainties in the market, only probabilities. If MGM was to move back above the two-year trendline — currently around 34 to 35 &mdahs; it could be a big clue that the path of least resistance is up. You want to have leeway around Fibonacci clusters. If MGM can move above 41 it could open the door for a rally to 60. Barring a move above the trendline, MGM is vulnerable to going down much lower. How much lower? Major support for MGM is the February 2016 bottom around 16, this would be nearly a 50% drop. You may think this is outlandish, but remember this stock once had a 98% decline. There are always fundamental reasons for stocks having big moves up and down. Sadly, many times the reasons aren't known until after the big move. The earliest news comes from the behavior patterns of stocks. In MGM's case the news is to sell. Further Reading: Frost A.J and Robert Prechter (1985) "Elliott Wave Principle", New Classics Library. |
Independent investment advisor, trader and writer. He has written articles for Technical Analysis of Stocks & Commodities, Traders.com Advantage,Futuresmag.com and, Finance Magnates. Author of website Four Dimension Trading.
| Website: | www.fourdimensiontrading.com |
| E-mail address: | markrivest@gmail.com |
Click here for more information about our publications!
PRINT THIS ARTICLE

Request Information From Our Sponsors
- VectorVest, Inc.
- Executive Premier Workshop
- One-Day Options Course
- OptionsPro
- Retirement Income Workshop
- Sure-Fire Trading Systems (VectorVest, Inc.)
- Trading as a Business Workshop
- VectorVest 7 EOD
- VectorVest 7 RealTime/IntraDay
- VectorVest AutoTester
- VectorVest Educational Services
- VectorVest OnLine
- VectorVest Options Analyzer
- VectorVest ProGraphics v6.0
- VectorVest ProTrader 7
- VectorVest RealTime Derby Tool
- VectorVest Simulator
- VectorVest Variator
- VectorVest Watchdog
- StockCharts.com, Inc.
- Candle Patterns
- Candlestick Charting Explained
- Intermarket Technical Analysis
- John Murphy on Chart Analysis
- John Murphy's Chart Pattern Recognition
- John Murphy's Market Message
- MurphyExplainsMarketAnalysis-Intermarket Analysis
- MurphyExplainsMarketAnalysis-Visual Analysis
- StockCharts.com
- Technical Analysis of the Financial Markets
- The Visual Investor