HOT TOPICS LIST
- MACD
- Fibonacci
- RSI
- Gann
- ADXR
- Stochastics
- Volume
- Triangles
- Futures
- Cycles
- Volatility
- ZIGZAG
- MESA
- Retracement
- Aroon
INDICATORS LIST
LIST OF TOPICS
PRINT THIS ARTICLE
by Koos van der Merwe
With the stock market behaving the way it has since January 2018, how does one find a winner?
Position: Buy
Koos van der Merwe
Has been a technical analyst since 1969, and has worked as a futures and options trader with First Financial Futures in Johannesburg, South Africa.
PRINT THIS ARTICLE
MOVING AVERAGES
Looking For A Winner
06/22/18 04:11:50 PMby Koos van der Merwe
With the stock market behaving the way it has since January 2018, how does one find a winner?
Position: Buy
| Since January 2018, the stock market appears to be in a major Elliott wave ABC correction. Some charts suggest that the correction is a WAVE 4 with a WAVE 5 to new highs still to come, while other charts are suggesting that the indexes are tracing a WAVE B uptrend with a major WAVE C correction around the corner. Time will tell which count is correct, but in the meantime, how does one find a share to invest in? There are many ways to do that, but I have found the JM Strategy, a very conservative strategy, to be the most reliable. The JM strategy is a simple 15-period moving average offset by 2% positive and 2% negative. A move above the upper band signals a buy, and below the lower band a sell. Of course, with some stocks, a 2% band is far too large. This can be reduced to a 1% offset, or even less, but a 15-period moving average band has proven very successful in good, and bad, times. |

|
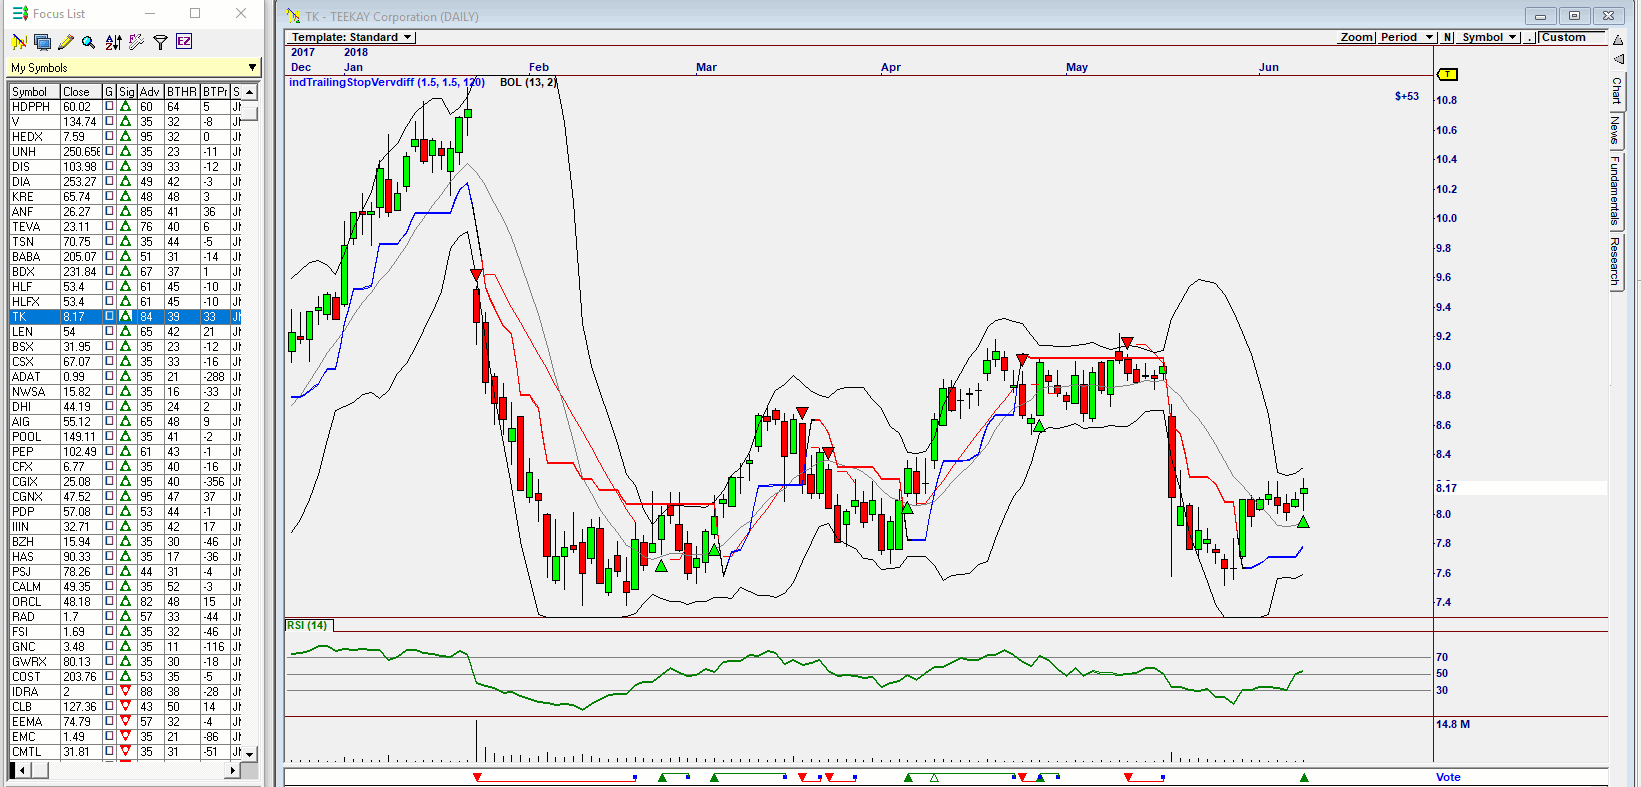
| Figure 1. TEEKAY Corporation. |
| Graphic provided by: Omnitrader. |
| |
| Looking at a chart of Omnitrader with the JM Strategy, testing 2052 shares at the close of trading on Friday June 8, as shown in Figure 1, one can see how few buy signals have been given. Simply eyeballing the share shown, TEEKAY Corporation, one can see that following the strategy would have been profitable. |

|
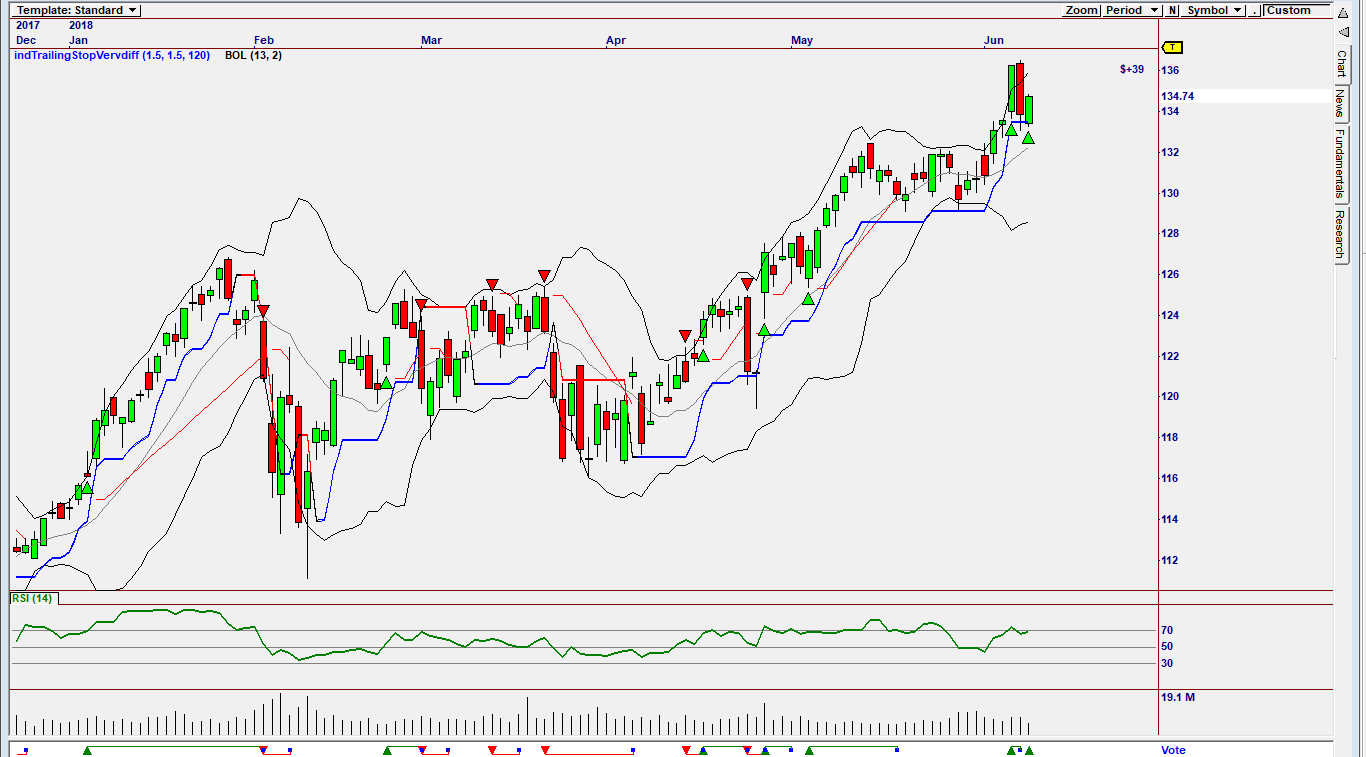
| Figure 2. Daily chart for Visa. |
| Graphic provided by: Omnitrader. |
| |
| The chart in Figure 2 is a chart of VISA (V), suggesting a buy. However, do note the RSI Indicator which is at overbought levels. This suggests that although the JM Strategy has suggested a buy, the share should not be bought. History has shown that one should only buy a share suggested by the JM Strategy when the RSI is at oversold levels, ie below the 32 horizontal line and then suggesting a buy. Finding a way to analyze the share market and find those shares that could be buys is not easy, however years of analysis have found that using the JM Strategy to analyze the market has been highly successful, and combined with an indicator like the RSI indicator, even more successful. |
Has been a technical analyst since 1969, and has worked as a futures and options trader with First Financial Futures in Johannesburg, South Africa.
| Address: | 3256 West 24th Ave |
| Vancouver, BC | |
| Phone # for sales: | 6042634214 |
| E-mail address: | petroosp@gmail.com |
Click here for more information about our publications!
Comments
Date: 07/06/18Rank: 4Comment:

Request Information From Our Sponsors
- VectorVest, Inc.
- Executive Premier Workshop
- One-Day Options Course
- OptionsPro
- Retirement Income Workshop
- Sure-Fire Trading Systems (VectorVest, Inc.)
- Trading as a Business Workshop
- VectorVest 7 EOD
- VectorVest 7 RealTime/IntraDay
- VectorVest AutoTester
- VectorVest Educational Services
- VectorVest OnLine
- VectorVest Options Analyzer
- VectorVest ProGraphics v6.0
- VectorVest ProTrader 7
- VectorVest RealTime Derby Tool
- VectorVest Simulator
- VectorVest Variator
- VectorVest Watchdog
- StockCharts.com, Inc.
- Candle Patterns
- Candlestick Charting Explained
- Intermarket Technical Analysis
- John Murphy on Chart Analysis
- John Murphy's Chart Pattern Recognition
- John Murphy's Market Message
- MurphyExplainsMarketAnalysis-Intermarket Analysis
- MurphyExplainsMarketAnalysis-Visual Analysis
- StockCharts.com
- Technical Analysis of the Financial Markets
- The Visual Investor
