HOT TOPICS LIST
- MACD
- Fibonacci
- RSI
- Gann
- ADXR
- Stochastics
- Volume
- Triangles
- Futures
- Cycles
- Volatility
- ZIGZAG
- MESA
- Retracement
- Aroon
INDICATORS LIST
LIST OF TOPICS
PRINT THIS ARTICLE
by Stella Osoba, CMT
Regeneron Pharmaceuticals, Inc. (REGN) has been trading below its 50-day moving average since August 2017. Its stock, which once touched highs of 605, is now trading at 293. So what's in store for this stock? Is it wise to wait for an opportunity to short the stock, or is the worst behind it and should we look for a rebound?
Position: N/A
Stella Osoba, CMT
Stella Osoba is a trader and financial writer. She is a frequent contributor to "Technical Analysis of Stocks and Commodities" magazine and "Traders.com Advantage" as well as other financial publications.
PRINT THIS ARTICLE
TECHNICAL ANALYSIS
Staying Mindful
06/12/18 05:38:40 PMby Stella Osoba, CMT
Regeneron Pharmaceuticals, Inc. (REGN) has been trading below its 50-day moving average since August 2017. Its stock, which once touched highs of 605, is now trading at 293. So what's in store for this stock? Is it wise to wait for an opportunity to short the stock, or is the worst behind it and should we look for a rebound?
Position: N/A
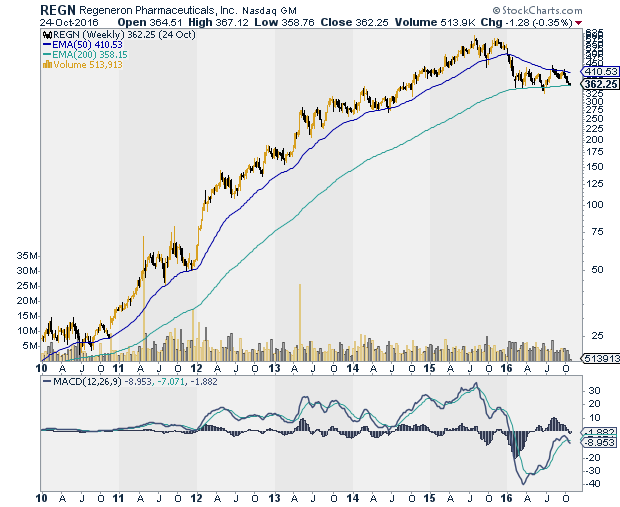
| A look back at a historical chart of REGN will reveal that its current price behavior shows that there has been a distinct change of character. Going back to 2010, the price behavior of REGN was orderly and almost predictable (See Figure 1). The trend was up, with reactions stopping at, or near, the 50-day moving average. Higher highs and higher lows confirmed an orderly uptrend. |

|
| Figure 1. Weekly chart for REGN. |
| Graphic provided by: StockCharts.com. |
| |
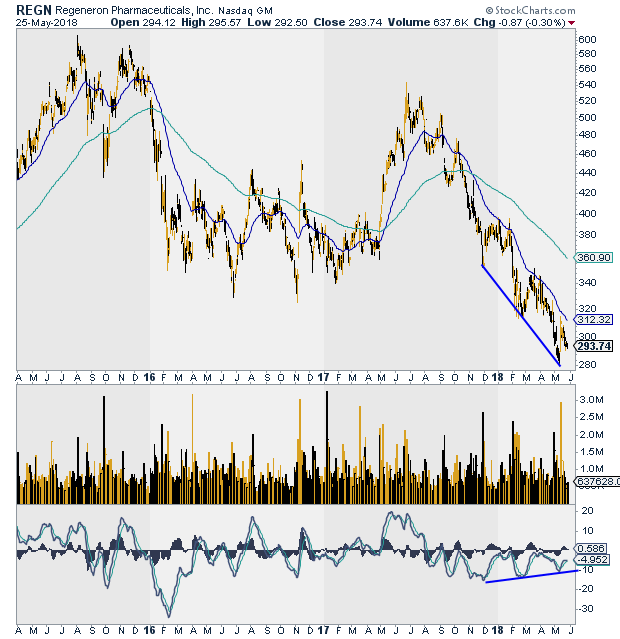
| The trend change happened in 2016 when price fell below the 50-day moving average. The sideways price action which followed the steep drop gave it the appearance of base building. But this was unlikely to be the case as the price drop, through sharp and steep, was not significant enough in terms of time and price in light of the prior uptrend (See Figure 2). |

|
| Figure 2. Divergence between price and the MACD. |
| Graphic provided by: StockCharts.com. |
| |
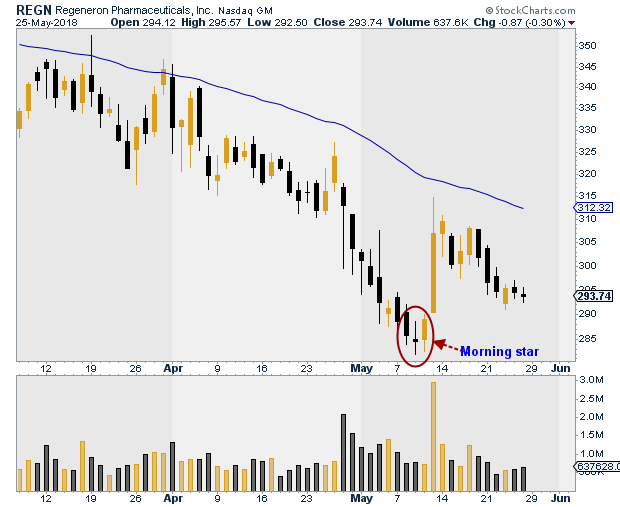
| After 4 months of sideways price action, price broke out of the base. Resolution was either going to be to the upside or to the downside. The breakout on May 1, 2018, pointed to an upside breakout, which was short lived. Bears dragged the stock back down below the 50-day moving average. A series of orderly lower highs and lower lows now tell us that the trend is down. The last low was a morning star pattern which suggested a rise (See Figure 3). The rise did happen, but remember candlestick patterns are short term signals. The rise eventually resolved to the downside. |

|
| Figure 3. Daily chart for REGN. |
| Graphic provided by: StockCharts.com. |
| |
| The MACD in the panel below price shows higher lows compared to price's lower lows. This is positive divergence and in some circumstances is bullish. But remember that divergence signals in persistent trends (up or down) can be misleading. Also signals from oscillators are secondary to those coming from price. Price is still firmly bearish. |
| Not every stock will form a substantial base from which to break out of, but that is exactly what we need to see to be able to determine with any degree of accuracy the next likely direction of price. Even if the stock were to break above its moving average, the lack of a base after such a sustained downtrend does not bode well for a sustained uptrend. This is not a stock to write off. But I would put it on the watchlist category and wait for price action to play out and create a pattern worth trading. |
Stella Osoba is a trader and financial writer. She is a frequent contributor to "Technical Analysis of Stocks and Commodities" magazine and "Traders.com Advantage" as well as other financial publications.
| E-mail address: | stellaosoba@gmail.com |
Click here for more information about our publications!
PRINT THIS ARTICLE

Request Information From Our Sponsors
- StockCharts.com, Inc.
- Candle Patterns
- Candlestick Charting Explained
- Intermarket Technical Analysis
- John Murphy on Chart Analysis
- John Murphy's Chart Pattern Recognition
- John Murphy's Market Message
- MurphyExplainsMarketAnalysis-Intermarket Analysis
- MurphyExplainsMarketAnalysis-Visual Analysis
- StockCharts.com
- Technical Analysis of the Financial Markets
- The Visual Investor
- VectorVest, Inc.
- Executive Premier Workshop
- One-Day Options Course
- OptionsPro
- Retirement Income Workshop
- Sure-Fire Trading Systems (VectorVest, Inc.)
- Trading as a Business Workshop
- VectorVest 7 EOD
- VectorVest 7 RealTime/IntraDay
- VectorVest AutoTester
- VectorVest Educational Services
- VectorVest OnLine
- VectorVest Options Analyzer
- VectorVest ProGraphics v6.0
- VectorVest ProTrader 7
- VectorVest RealTime Derby Tool
- VectorVest Simulator
- VectorVest Variator
- VectorVest Watchdog
