HOT TOPICS LIST
- MACD
- Fibonacci
- RSI
- Gann
- ADXR
- Stochastics
- Volume
- Triangles
- Futures
- Cycles
- Volatility
- ZIGZAG
- MESA
- Retracement
- Aroon
INDICATORS LIST
LIST OF TOPICS
PRINT THIS ARTICLE
by Koos van der Merwe
What are FANG Stocks? FANG is the acronym for Facebook, Amazon, Netflix and Google.
Position: Sell
Koos van der Merwe
Has been a technical analyst since 1969, and has worked as a futures and options trader with First Financial Futures in Johannesburg, South Africa.
PRINT THIS ARTICLE
TECHNICAL ANALYSIS
Another Look At FANG
06/12/18 05:47:53 PMby Koos van der Merwe
What are FANG Stocks? FANG is the acronym for Facebook, Amazon, Netflix and Google.
Position: Sell
| The term FANG was coined by Jim Cramer, the host on CNBC's Mad Money. Fang represents the best performing stocks that have generated outstanding returns for investors. All the stocks trade on the Nasdaq. Google's name is now Alphabet, Inc. Fang stocks focus on technology and internet services and are considered to be growth stocks that reflect the general market trend. Today FANG stocks' growth is being compared to the dotcom crash of 2000. |

|
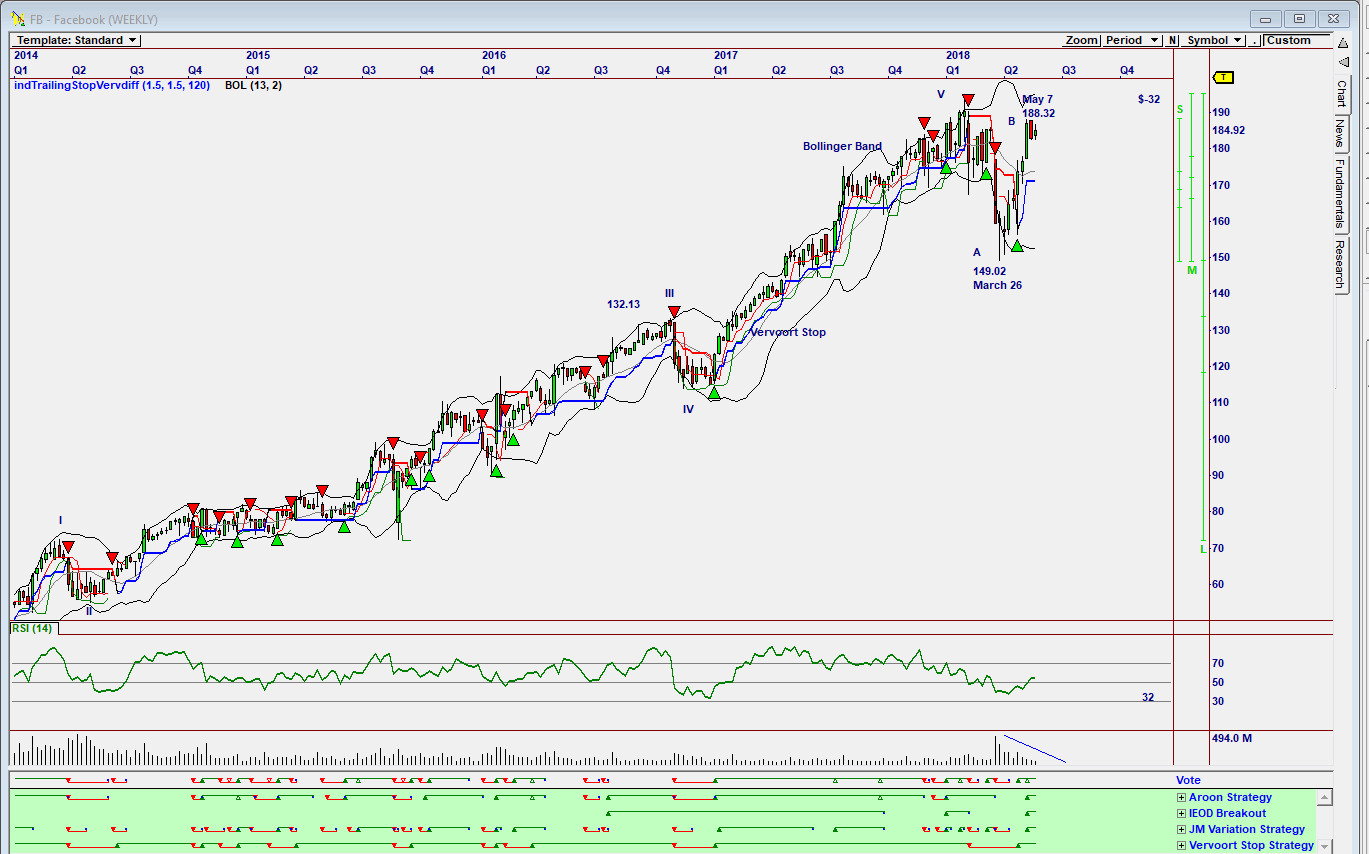
| Figure 1. Facebook. |
| Graphic provided by: Omnitrader. |
| |
| The chart in Figure 1 is a weekly Omnitrader chart of Facebook. The chart shows how the share price recently rose from a low of 149.02 on March 26 to a high of 188.32 by May 7. The Vote line on the chart is still suggesting a buy based on all three strategies shown below the Vote line, however, the RSI-14 Index is still trending down although history has shown that the indicator did not break below and then rise above the 32 horizontal to suggest a buy. Volume has been falling as the share price rose suggesting weakness. The share price is also touching the upper Bollinger band suggesting a reversal could occur. Finally, do note the Elliott wave count which is suggesting that a C-Wave drop could start at any time, with a C-Wave fall to approximately 132.13, or lower. |

|
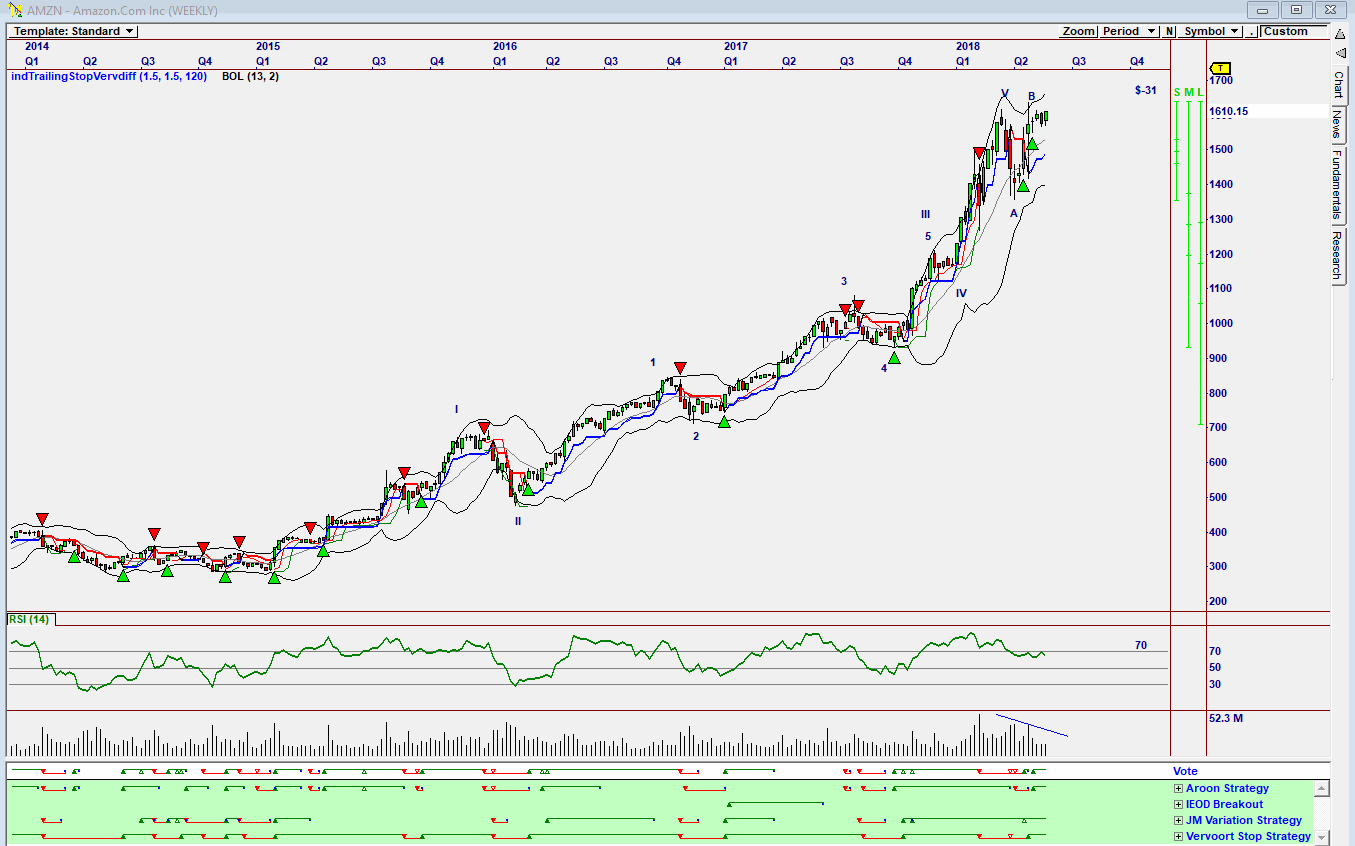
| Figure 2. Amazon. |
| Graphic provided by: Omnitrader. |
| |
| The chart in Figure 2 is a weekly chart of Amazon suggesting an Elliott wave count similar to that of Facebook. The Vote line is also suggesting a buy but the RSI index is trending down after giving a sell signal when it moved below the 70 horizontal. Volume is also falling suggesting weakness. |

|
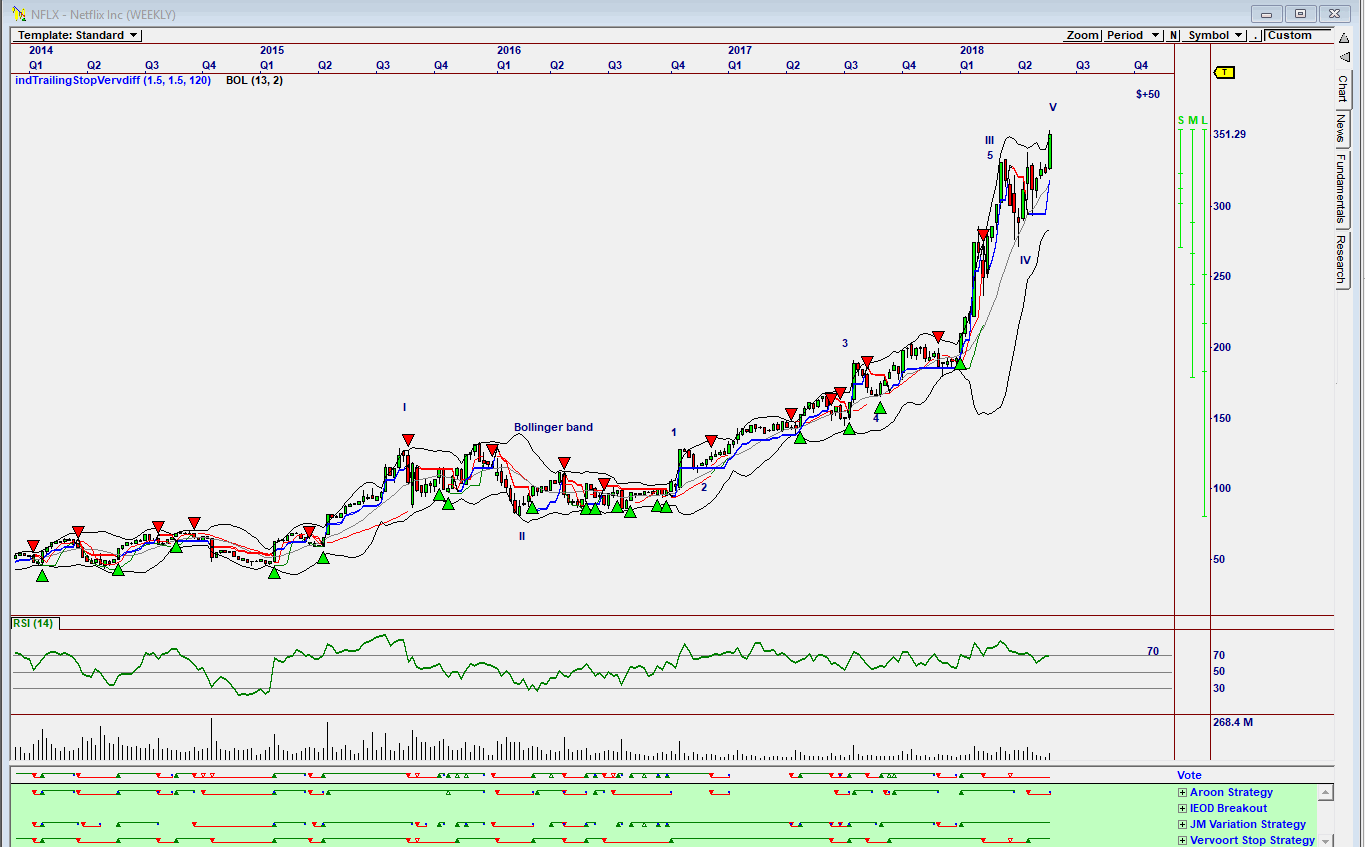
| Figure 3. Netflix. |
| Graphic provided by: Omnitrader. |
| |
| The chart in Figure 3 is a chart of Netflix. The chart is suggesting an Elliott Wave 5 topping out at the upper Bollinger band line. Once again, the RSI indicator has given a sell by falling below the 70 horizontal. Do note the Vote line which is still showing a sell signal. Volume rose with the recent rise in price suggesting that there may still be some upside. |

|
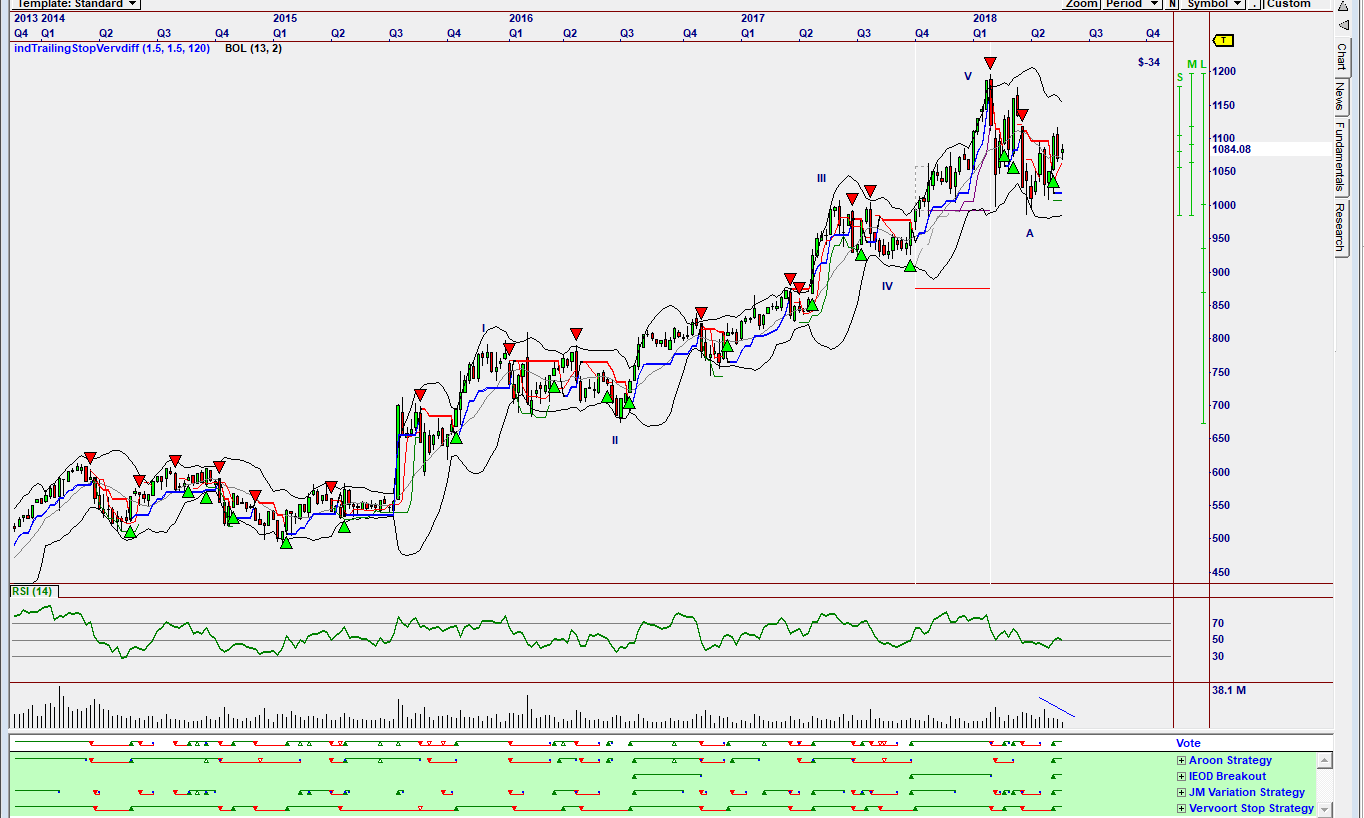
| Figure 4. Alphabet (Google). |
| Graphic provided by: Omnitrader. |
| |
| The chart in Figure 4 is a chart of Alphabet (Google). The Vote line is suggesting a buy based on all 4 strategies below the Vote line. Once again, the RSI indicator has not fallen below the 30 horizontal and has fallen below and risen above the 50 horizontal. Looking at past performance, it could be suggesting further upside. An Elliott wave count is suggesting that the share price could be in a WAVE B. All four charts are suggesting that the prices shown could be topping out in the near future. Elliott wave count is suggesting a C-Wave correction, which could be a strong correction, is around the corner. Caution prevails. |
Has been a technical analyst since 1969, and has worked as a futures and options trader with First Financial Futures in Johannesburg, South Africa.
| Address: | 3256 West 24th Ave |
| Vancouver, BC | |
| Phone # for sales: | 6042634214 |
| E-mail address: | petroosp@gmail.com |
Click here for more information about our publications!
PRINT THIS ARTICLE

Request Information From Our Sponsors
- StockCharts.com, Inc.
- Candle Patterns
- Candlestick Charting Explained
- Intermarket Technical Analysis
- John Murphy on Chart Analysis
- John Murphy's Chart Pattern Recognition
- John Murphy's Market Message
- MurphyExplainsMarketAnalysis-Intermarket Analysis
- MurphyExplainsMarketAnalysis-Visual Analysis
- StockCharts.com
- Technical Analysis of the Financial Markets
- The Visual Investor
- VectorVest, Inc.
- Executive Premier Workshop
- One-Day Options Course
- OptionsPro
- Retirement Income Workshop
- Sure-Fire Trading Systems (VectorVest, Inc.)
- Trading as a Business Workshop
- VectorVest 7 EOD
- VectorVest 7 RealTime/IntraDay
- VectorVest AutoTester
- VectorVest Educational Services
- VectorVest OnLine
- VectorVest Options Analyzer
- VectorVest ProGraphics v6.0
- VectorVest ProTrader 7
- VectorVest RealTime Derby Tool
- VectorVest Simulator
- VectorVest Variator
- VectorVest Watchdog
