

HOT TOPICS LIST
- MACD
- Fibonacci
- RSI
- Gann
- ADXR
- Stochastics
- Volume
- Triangles
- Futures
- Cycles
- Volatility
- ZIGZAG
- MESA
- Retracement
- Aroon
INDICATORS LIST
LIST OF TOPICS
PRINT THIS ARTICLE
by Koos van der Merwe
Reaching a high of 26153.42 in January 2018, the Dow Jones Index has since fallen. What now for the future?
Position: Sell
Koos van der Merwe
Has been a technical analyst since 1969, and has worked as a futures and options trader with First Financial Futures in Johannesburg, South Africa.
PRINT THIS ARTICLE
ELLIOTT WAVE
Looking At The Indexes
06/08/18 05:14:38 PMby Koos van der Merwe
Reaching a high of 26153.42 in January 2018, the Dow Jones Index has since fallen. What now for the future?
Position: Sell
| The Dow Jones rose strongly with the election of Donald Trump as President of the United States of America. However, from the start of February 2018, the index has fallen. Why? One doesn't know for certain, because so many things have happened in the USA. The firing of many who served the Presidency; school shootings with the Presidency leaning towards support of the NRA (National Rifle Association); the American Embassy moving to Jerusalem and declaring the city the capital of Israel. Who knows exactly what the reason is, but one thing for sure is occurring and that is the continued fall of the Dow. |
|
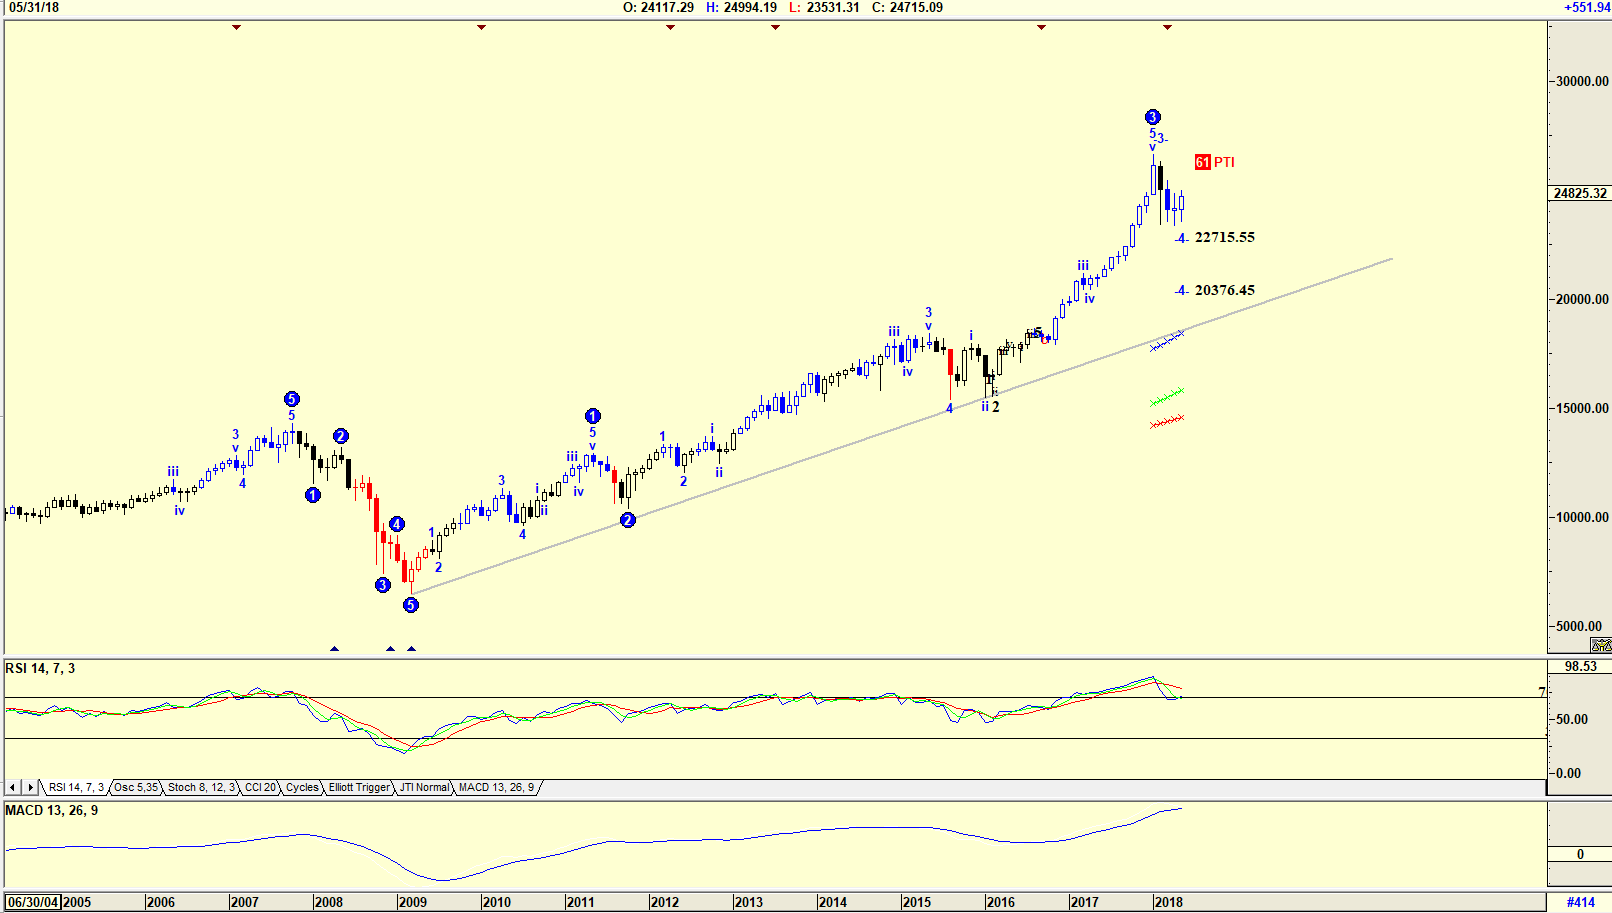
| Figure 1. Monthly chart of the Dow Jones. |
| Graphic provided by: AdvancedGET. |
| |
| The monthly Elliott wave count of an Advanced GET chart in Figure 1 does suggest that the Dow could be in a WAVE 4 correction, with a target of either 22715.55 or 20376.45. The is confirmed by the RSI-14 indicator which is falling from overbought levels and has given a sell signal by falling below the 70 horizontal. The MACD indicator has also given a sell. So with an Elliott wave count suggesting a correction and both indicators giving sell signals, we can definitely expect the Dow to fall. The PTI (probability Index) is at 61, suggesting that there is only a 61% probability that the index could rise. |
|
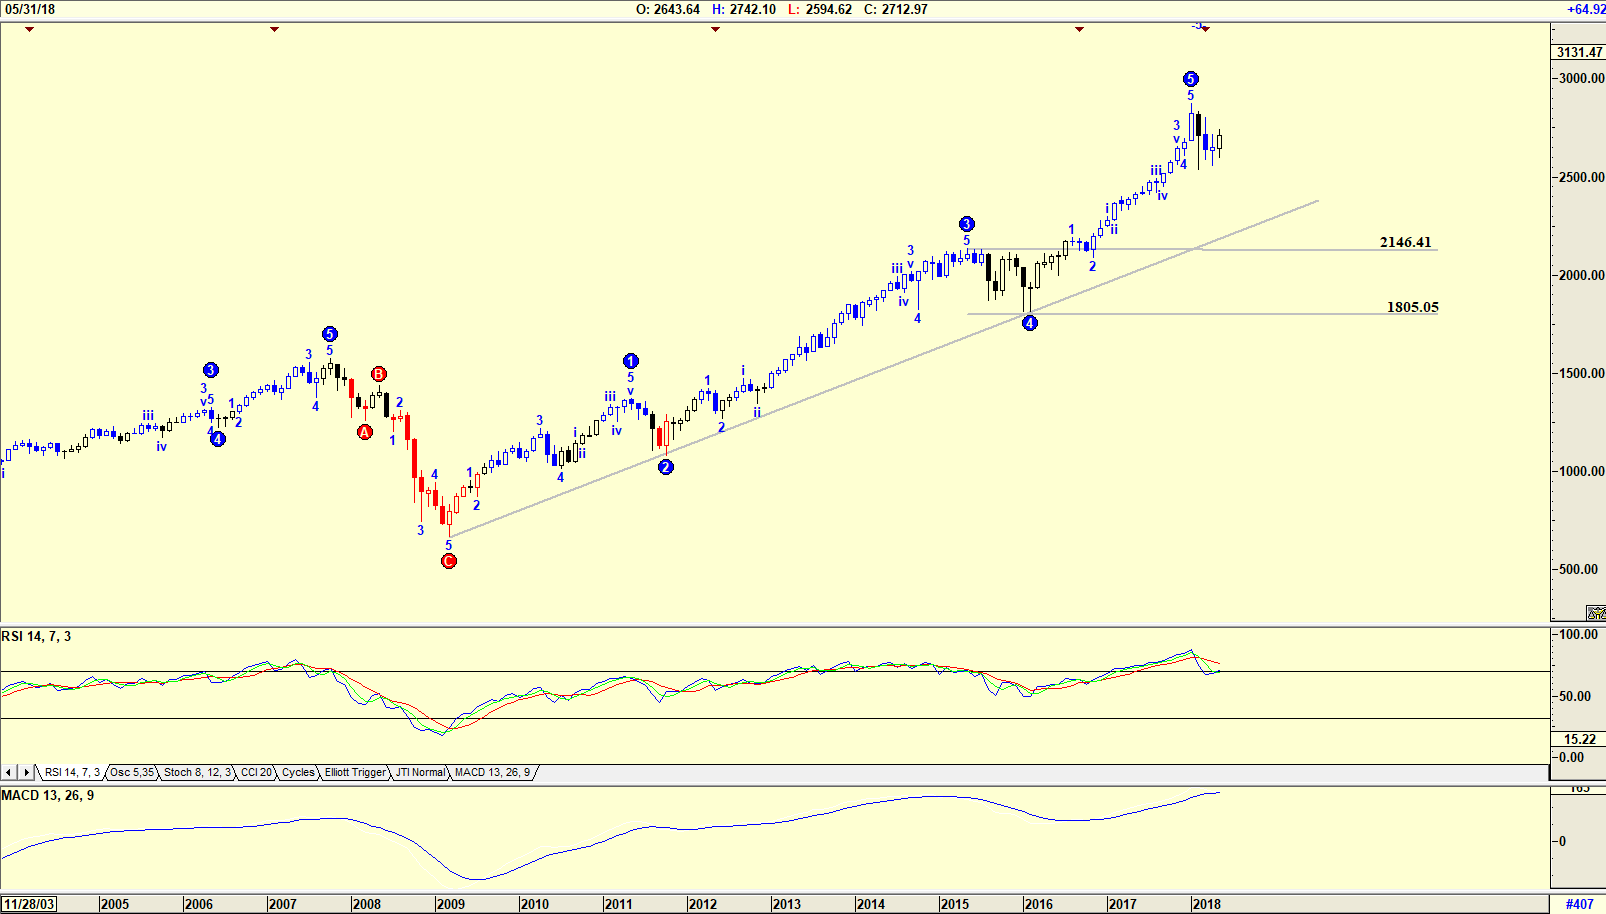
| Figure 2. Monthly Chart of the S&P 500 Index, |
| Graphic provided by: AdvancedGET. |
| |
| The S&P 500 monthly chart suggests an Elliott wave count of a WAVE 5 top, unlike that of the Dow in Figure 1. A wave 5 correction usually bottoms within the 4th wave of lesser degree. This suggests that the index could fall to somewhere between 2146.41 and 1805.05. Once again, both the RSI and MACD indicators are suggesting a sell. |
|
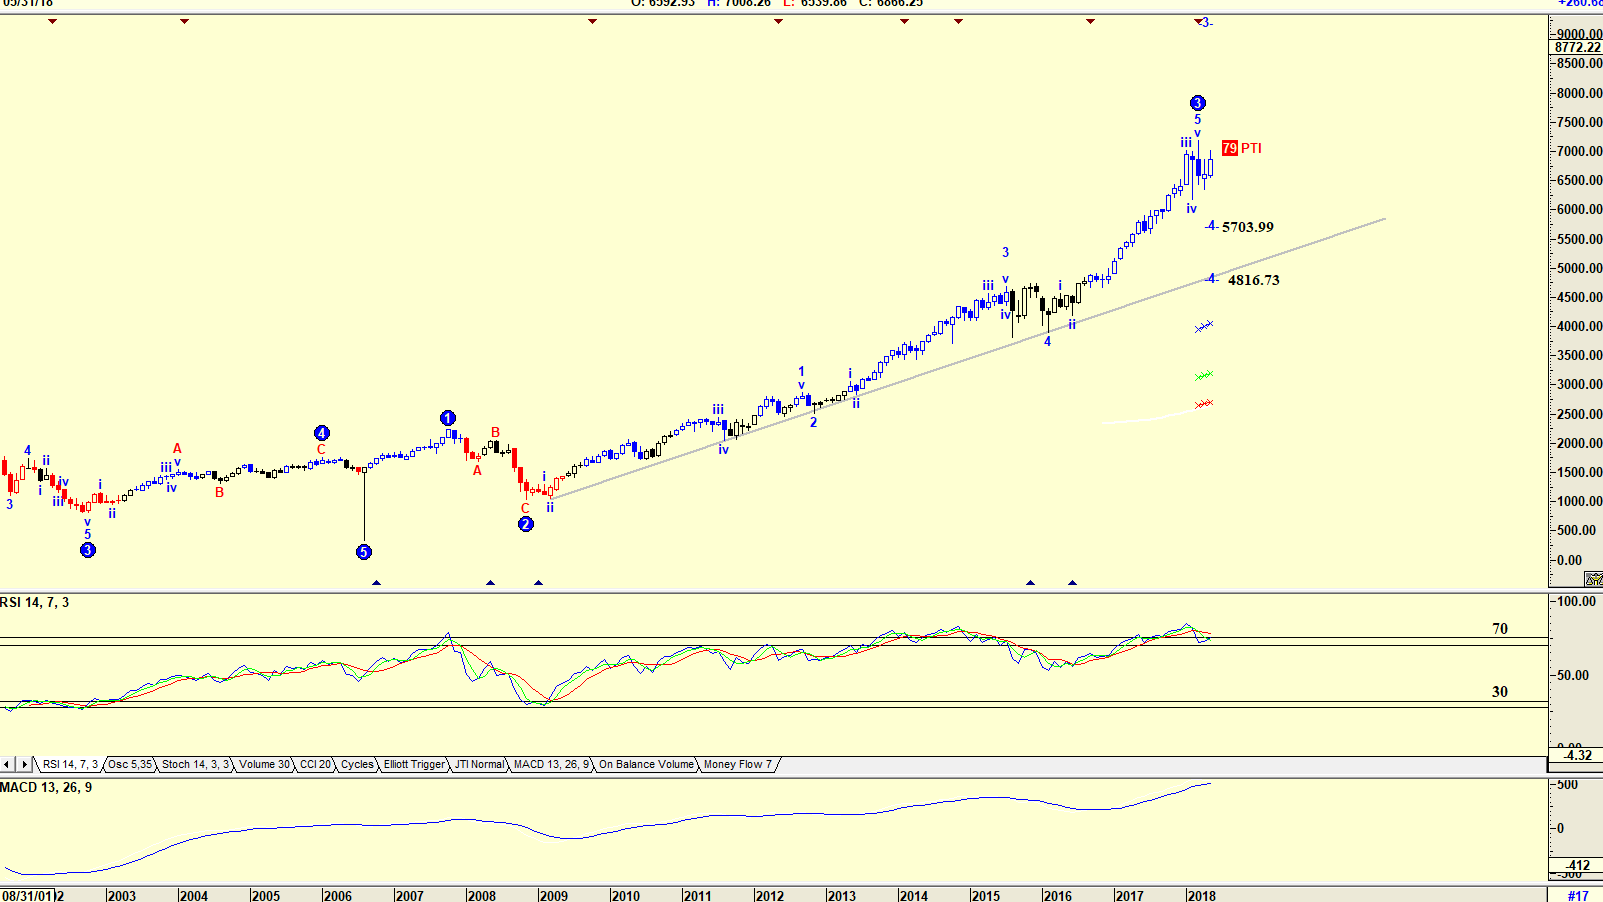
| Figure 3. Monthly chart of the Nasdaq. |
| Graphic provided by: AdvancedGET. |
| |
| The monthly chart of the Nasdaq Index, like the Dow in Figure 1 is suggesting an Elliott wave count of a WAVE 3 with a fall in a WAVE 4 to either 5703.99 or 4816.73. Once again the RSI indicator is suggesting a sell but the MACD indicator is close to giving a sell, but has not. The PTI index is 73. All three major Indexes are suggesting a sell. With the "Sell in May" mantra tickling one's mind, a major correction is definitely there. The only problem is for how long? Caution for the coming months is definitely on the cards. |
Has been a technical analyst since 1969, and has worked as a futures and options trader with First Financial Futures in Johannesburg, South Africa.
| Address: | 3256 West 24th Ave |
| Vancouver, BC | |
| Phone # for sales: | 6042634214 |
| E-mail address: | petroosp@gmail.com |
Click here for more information about our publications!
PRINT THIS ARTICLE

Request Information From Our Sponsors
- StockCharts.com, Inc.
- Candle Patterns
- Candlestick Charting Explained
- Intermarket Technical Analysis
- John Murphy on Chart Analysis
- John Murphy's Chart Pattern Recognition
- John Murphy's Market Message
- MurphyExplainsMarketAnalysis-Intermarket Analysis
- MurphyExplainsMarketAnalysis-Visual Analysis
- StockCharts.com
- Technical Analysis of the Financial Markets
- The Visual Investor
- VectorVest, Inc.
- Executive Premier Workshop
- One-Day Options Course
- OptionsPro
- Retirement Income Workshop
- Sure-Fire Trading Systems (VectorVest, Inc.)
- Trading as a Business Workshop
- VectorVest 7 EOD
- VectorVest 7 RealTime/IntraDay
- VectorVest AutoTester
- VectorVest Educational Services
- VectorVest OnLine
- VectorVest Options Analyzer
- VectorVest ProGraphics v6.0
- VectorVest ProTrader 7
- VectorVest RealTime Derby Tool
- VectorVest Simulator
- VectorVest Variator
- VectorVest Watchdog