

HOT TOPICS LIST
- MACD
- Fibonacci
- RSI
- Gann
- ADXR
- Stochastics
- Volume
- Triangles
- Futures
- Cycles
- Volatility
- ZIGZAG
- MESA
- Retracement
- Aroon
INDICATORS LIST
LIST OF TOPICS
PRINT THIS ARTICLE
by Mark Rivest
See why this technology stock could decline forty percent in one year.
Position: Sell
Mark Rivest
Independent investment advisor, trader and writer. He has written articles for Technical Analysis of Stocks & Commodities, Traders.com Advantage,Futuresmag.com and, Finance Magnates. Author of website Four Dimension Trading.
PRINT THIS ARTICLE
STOCKS
Could Symantec be Ripe for a Fall?
05/17/18 02:14:38 PMby Mark Rivest
See why this technology stock could decline forty percent in one year.
Position: Sell
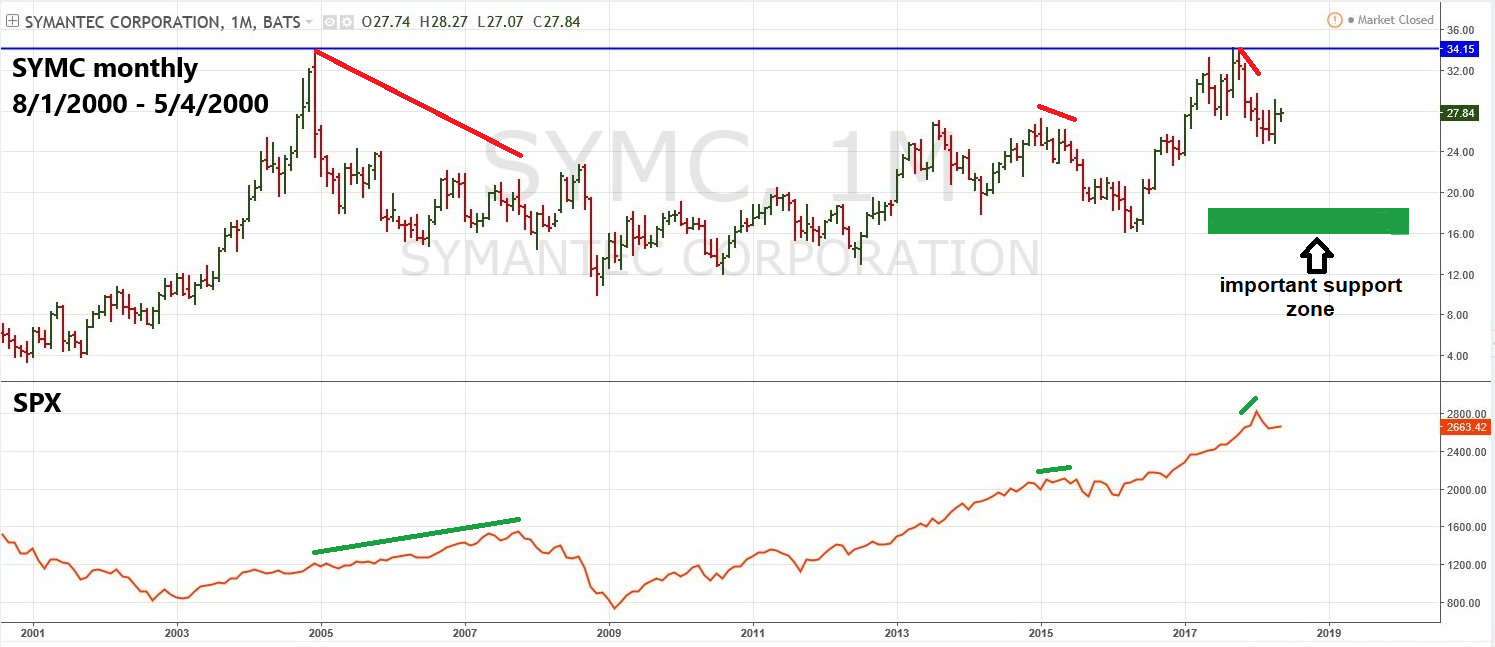
| Symantec corporation (SYMC), which provides cybersecurity solutions worldwide, has been lagging the S&P 500 (SPX) since 2004. You could have purchased shares of SYMC in September of 2004, held them until early May 2018, and would have gained very little in share value. A powerful combination of long and short-term signals, together with bearish stock factors indicate that within a year SYMC could have a huge decline. Long-term Picture Please see the monthly SYMC chart illustrated in Figure 1. The most striking feature of the monthly SYMC chart is its poor performance when compared to the SPX. If you want to risk precious investment/trading capital on an individual stock the expectation would be for the stock to greatly outperform a stock index. The next striking feature is the incredible double top made at 34.05 in December of 2004 and at 34.20 September 2017. A difference of only 15 cents over a period of thirteen years is amazingly accurate. The subsequent five-month 27% decline represents a clear rejection of SYMC at 34.00, and based on what happened in 2004, implies a top that could hold for years. Finally, SYMC has a history of peaking prior to the SPX. This happened in 2004 when it registered its then all-time high three years prior to the SPX top in 2007. The same phenomenon happened again to a lesser degree at the SYMC intermediate top made in January 2015. SYMC peaked at 27.32 then had a three-month 16% decline as the SPX made marginal gains. The SYMC September 2017 all-time high so far represents the third example of the SPX rallying after a SYMC top holds. If the SPX exceeds its January high with SYMC failing to exceed its September 2017 peak, it would be another sign of SYMC lagging the broader stock market. |
|
| Figure 1. The most striking feature of the monthly SYMC chart is its poor performance when compared to the SPX. |
| Graphic provided by: Tradingview.com. |
| |
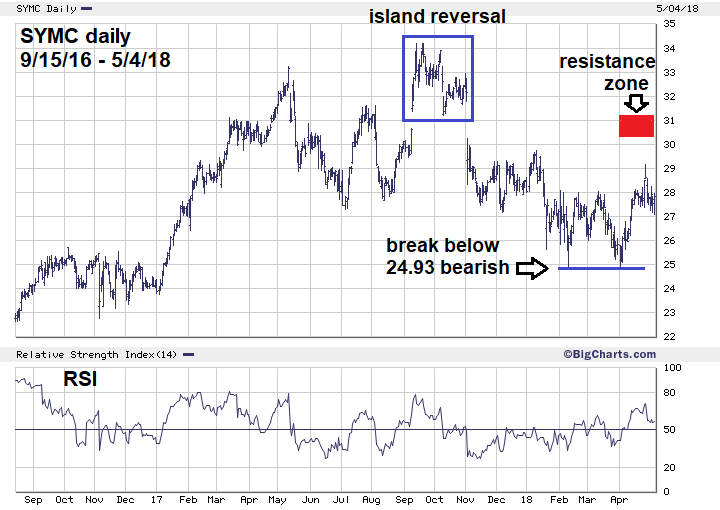
| Short-term Picture The daily chart illustrated in Figure 2 shows that SYMC gapped up just before recording its September 20 high at 34.20. On November 2 SYMC had a huge gap down creating an Island Reversal. This is a strong reversal pattern because it leaves many traders/investors trapped in trades at poor prices. There could be great incentive to sell if SYMC gets near the island. Since April 2 SYMC has been rising. Typically stocks, or stock indices, will make secondary tops at a Fibonacci retracement of .618 to .666. In this case, the retracement range is from the 34.20 top to the April 2 bottom at 24.93. The ideal target zone for a secondary peak is between 30.66 to 31.10 — which is just below the island reversal. The double bottom made at 24.94 in February and at 24.93 made in April is strong support. Breaches of double bottoms/tops are usually powerful. A break below 24.93 could open the door for SYMC to decline all the way back to the double bottom made in March and May of 2016 at 16.14 and 16.25. Also note that on April 26, when SYMC reached 29.18, the daily RSI momentum indicator hit 69%, which is just below the overbought zone at 70%. Its possible SYMC's secondary top could already be in place. |
|
| Figure 2. There could be great incentive to sell if SYMC gets near the island. |
| Graphic provided by: BigCharts.com. |
| |
| Stock Factors Institutions own 98% of SYMC shares. Insiders hold approximately 1%. It takes concentrated buying for stocks to achieve big moves up. It appears there's not much of SYMC's float left to buy. On the flip side there's a lot of potential for concentrated selling. SYMC's short interest as a percentage of the stock float is only 5%. The possibility of a short squeeze is minimal. Finally, the dividend yield of SYMC is only a meager 1%, not much of an incentive for income seeking buyers. |
| Conclusion SYMC has lagged the SPX for more than a decade. The thirteen-year double top implies a major decline may have begun. The enormous institutional ownership indicates plenty of fuel for concentrated selling. Watch the resistance zone between 30.66 to 31.10. This could be a very important secondary peak. Also focus on SYMC 24.93. A break below this support could be the last chance to sell before a significant decline. Based upon technical analysis the condition of SYMC is bearish. What would it take, based on technical analysis, to become bullish SYMC? A move above the multi-year double top at 34.20 could trigger a strong and sustained multi-month rally. This is a low probability scenario considering the many bearish signals and factors. Within a year SYMC could reach important support in the low 16 areas. Over a period of more than a year SYMC could get all the way back down to its major bottom at 10.05 made in November 2008. Technical analysis provides a great tool for entering and exiting positions. It doesn't tell us why moves up or down are being made. Regardless of which direction SYMC moves in the coming months there will be a fundamental reason. Sadly, many times the reason for a big stock move comes too late to take effective action. Your chances of profiting are increased by concentrating on technical analysis instead of waiting for news about the fundamentals. Further Reading: Frost A.J and Robert Prechter (1985) "Elliott Wave Principle", New Classics Library. |
Independent investment advisor, trader and writer. He has written articles for Technical Analysis of Stocks & Commodities, Traders.com Advantage,Futuresmag.com and, Finance Magnates. Author of website Four Dimension Trading.
| Website: | www.fourdimensiontrading.com |
| E-mail address: | markrivest@gmail.com |
Click here for more information about our publications!
PRINT THIS ARTICLE

Request Information From Our Sponsors
- StockCharts.com, Inc.
- Candle Patterns
- Candlestick Charting Explained
- Intermarket Technical Analysis
- John Murphy on Chart Analysis
- John Murphy's Chart Pattern Recognition
- John Murphy's Market Message
- MurphyExplainsMarketAnalysis-Intermarket Analysis
- MurphyExplainsMarketAnalysis-Visual Analysis
- StockCharts.com
- Technical Analysis of the Financial Markets
- The Visual Investor
- VectorVest, Inc.
- Executive Premier Workshop
- One-Day Options Course
- OptionsPro
- Retirement Income Workshop
- Sure-Fire Trading Systems (VectorVest, Inc.)
- Trading as a Business Workshop
- VectorVest 7 EOD
- VectorVest 7 RealTime/IntraDay
- VectorVest AutoTester
- VectorVest Educational Services
- VectorVest OnLine
- VectorVest Options Analyzer
- VectorVest ProGraphics v6.0
- VectorVest ProTrader 7
- VectorVest RealTime Derby Tool
- VectorVest Simulator
- VectorVest Variator
- VectorVest Watchdog