HOT TOPICS LIST
- MACD
- Fibonacci
- RSI
- Gann
- ADXR
- Stochastics
- Volume
- Triangles
- Futures
- Cycles
- Volatility
- ZIGZAG
- MESA
- Retracement
- Aroon
INDICATORS LIST
LIST OF TOPICS
PRINT THIS ARTICLE
by Gary Grosschadl
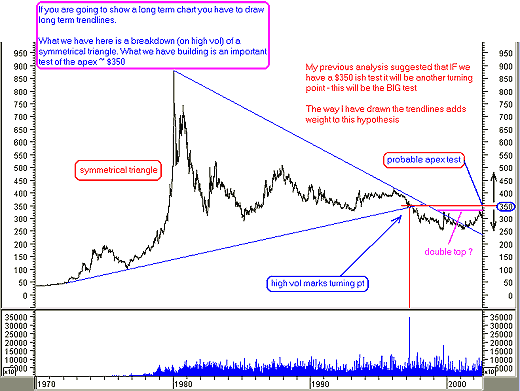
This 30-year gold chart has some interesting implications revolving around the largest symmetrical triangle I have ever tried to analyze.
Position: Hold
Gary Grosschadl
Independent Canadian equities trader and technical analyst based in Peterborough
Ontario, Canada.
PRINT THIS ARTICLE
SYMMETRICAL TRIANGLE
A BIG Symmetrical Triangle In Gold
12/13/02 07:55:10 AMby Gary Grosschadl
This 30-year gold chart has some interesting implications revolving around the largest symmetrical triangle I have ever tried to analyze.
Position: Hold
| Symmetrical triangles are neutral in that they can break either way. The way to play them correctly is to wait for the telling break, ideally on large volume. This chart shows the downside breakout in gold on very large volume that occurred in 1997. Within three years the price of gold declined from $350 to $260. |
| Sometimes when these triangles fail there follows a reaction move back to the apex of the triangle before resuming in the direction of the original break. This implies a possible move up to test the apex with a failure to follow through and some considerable downside to come. I prefer to view this as a probable test of very stiff resistance. I should then be alert for a big move either way, although I lean towards the likelihood of a brief, war-driven spike upwards with an eventual move back down. |

|
| Graphic provided by: MetaStock. |
| |
| In order to test this apex's $350ish resistance, gold has to first beat a resistance wall from $330-335. Failure here could indicate a double top failure and a move back down, negating the surmised $350 apex test. |
| So in summary, wait and see which pattern will prevail-- a shorter term double top, or the larger pattern's apex test of a very big symmetrical triangle. A third possibility, less likely, is that this symmetrical triangle failure was a large whipsaw and gold will reverse to a "true" breakout destined to go much higher than $350 gold. Let's call that the diehard goldbug version. In these uncertain times don't rule out the wildcard scenarios just in case. |
Independent Canadian equities trader and technical analyst based in Peterborough
Ontario, Canada.
| Website: | www.whatsonsale.ca/financial.html |
| E-mail address: | gwg7@sympatico.ca |
Click here for more information about our publications!
Comments
Date: 12/17/02Rank: 3Comment:
Date: 12/17/02Rank: 5Comment:

Request Information From Our Sponsors
- StockCharts.com, Inc.
- Candle Patterns
- Candlestick Charting Explained
- Intermarket Technical Analysis
- John Murphy on Chart Analysis
- John Murphy's Chart Pattern Recognition
- John Murphy's Market Message
- MurphyExplainsMarketAnalysis-Intermarket Analysis
- MurphyExplainsMarketAnalysis-Visual Analysis
- StockCharts.com
- Technical Analysis of the Financial Markets
- The Visual Investor
- VectorVest, Inc.
- Executive Premier Workshop
- One-Day Options Course
- OptionsPro
- Retirement Income Workshop
- Sure-Fire Trading Systems (VectorVest, Inc.)
- Trading as a Business Workshop
- VectorVest 7 EOD
- VectorVest 7 RealTime/IntraDay
- VectorVest AutoTester
- VectorVest Educational Services
- VectorVest OnLine
- VectorVest Options Analyzer
- VectorVest ProGraphics v6.0
- VectorVest ProTrader 7
- VectorVest RealTime Derby Tool
- VectorVest Simulator
- VectorVest Variator
- VectorVest Watchdog
