HOT TOPICS LIST
- MACD
- Fibonacci
- RSI
- Gann
- ADXR
- Stochastics
- Volume
- Triangles
- Futures
- Cycles
- Volatility
- ZIGZAG
- MESA
- Retracement
- Aroon
INDICATORS LIST
LIST OF TOPICS
PRINT THIS ARTICLE
by Koos van der Merwe
When you trade the stock market, the one thing you do not want to do is gamble. However, there are times when a gamble is tempting.
Position: Accumulate
Koos van der Merwe
Has been a technical analyst since 1969, and has worked as a futures and options trader with First Financial Futures in Johannesburg, South Africa.
PRINT THIS ARTICLE
TECHNICAL ANALYSIS
Taking A Gamble
05/11/18 04:06:28 PMby Koos van der Merwe
When you trade the stock market, the one thing you do not want to do is gamble. However, there are times when a gamble is tempting.
Position: Accumulate
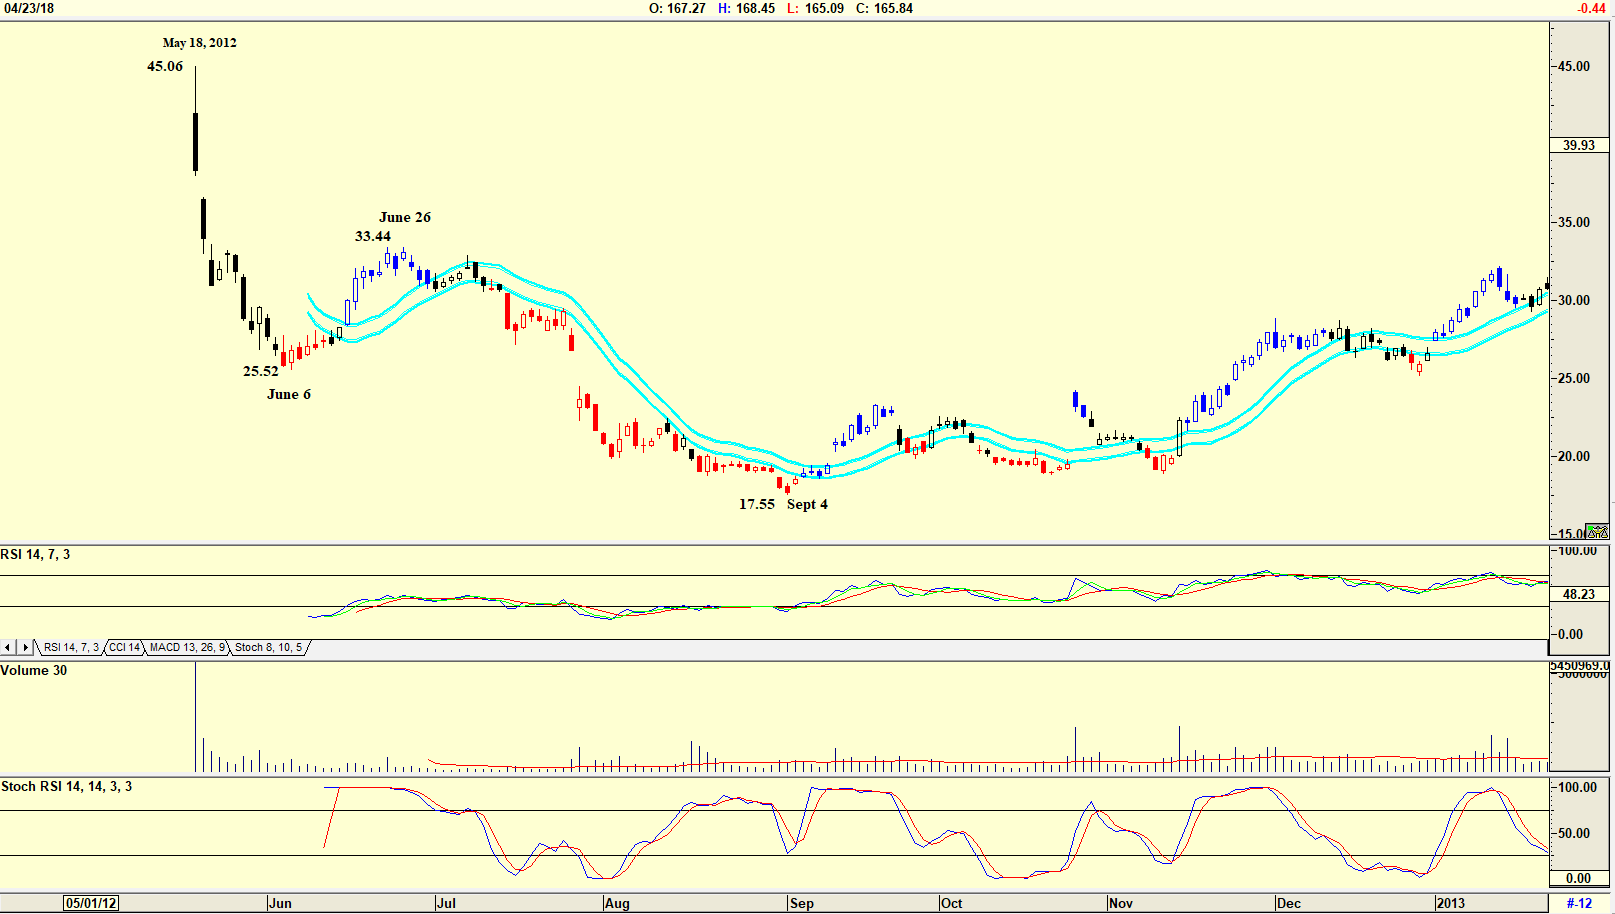
| On May 18, 2012, Facebook held its initial public offering (IPO). The IPO was the biggest in technology and one of the biggest in internet history. Mark Zuckerberg had resisted taking the company public for years, but when it crossed the threshold of 500 shareholders, Mark decided that the company should be listed on the stock exchange. Warning signs before the IPO suggested that many share holders were keen to sell their shares of the company. Goldman Sachs was ready to sell up to 50% of their share holding. And with its listing, the share price fell. |

|
| Figure 1. Daily chart of initial listing of Facebook. |
| Graphic provided by: AdvancedGET. |
| |
| The chart in Figure 1 shows how the share was listed on May 18, 2012, reaching a high of $45.06 and then falling to $25.52 by June 6. The share price then rose to $33.44 by June 26 and then fell to a low of $17.55 by September 4. From that low, the share price has been "up, up and away", reaching a high of $194.96 until its recent security problems when the share price fell. Has this taught us something? When a share lists, should one wait to see what happens before buying? |

|
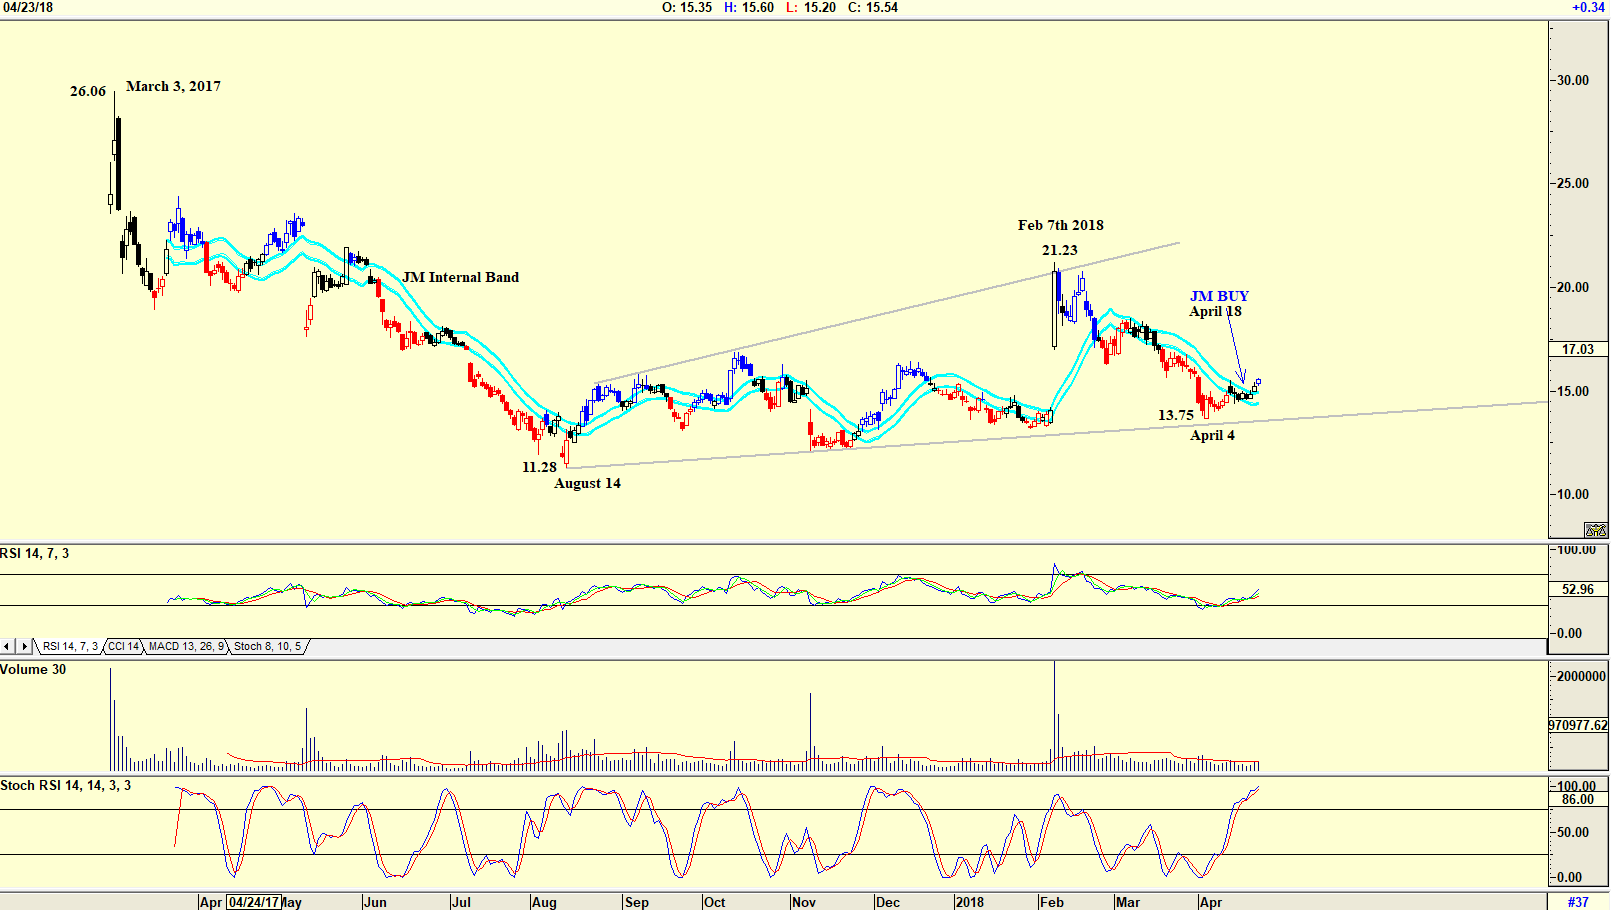
| Figure 2. Daily listing of SNAP. |
| Graphic provided by: AdvancedGET. |
| |
| Looking at the chart of SNAP, one can see how the share price hit the market at $26.06 on March 3, 2017 and then fell to $11.28 by August 14. Was this fall because of shareholders cashing in? The share price has since risen slowly and reached a high of $21.23 by February 7, 2018, before falling to a low of $13.75 by April 4. Where Facebook shares fell after its listing as shareholders sold shares, the same thing probably happened initially with SNAP shares, however the recent fall in the share price from $21.23 to $13.75 was because of an app overhaul. Following an app update, users complained that the latest version made it more difficult to see the stories from friends. The share price is starting to recover. Is it time to start nibbling at the share? Will it become another Facebook, and rise to crazy highs? The RSI Indicator is suggesting a buy, but the Stochastic RSI indicator is at overbought levels. Volume is below average, suggesting few buyers of the share. However, do note that the JM Internal Band suggested a buy. The JM Internal Band is a 15-period simple moving average offset by 2% positive and 2% negative. A move above the upper band is a buy and below the lower band a sell. Keeping an eye on the SNAP share price and slowly buying a few shares on every pullback is a gamble that could be profitable in the long run. Listening to its CEO talk on CNBC television program, one feels that here is a man that listens to complaints from users. Well, whatever, buying the share is a gamble that traders will take, but not investors. |
Has been a technical analyst since 1969, and has worked as a futures and options trader with First Financial Futures in Johannesburg, South Africa.
| Address: | 3256 West 24th Ave |
| Vancouver, BC | |
| Phone # for sales: | 6042634214 |
| E-mail address: | petroosp@gmail.com |
Click here for more information about our publications!
PRINT THIS ARTICLE

Request Information From Our Sponsors
- VectorVest, Inc.
- Executive Premier Workshop
- One-Day Options Course
- OptionsPro
- Retirement Income Workshop
- Sure-Fire Trading Systems (VectorVest, Inc.)
- Trading as a Business Workshop
- VectorVest 7 EOD
- VectorVest 7 RealTime/IntraDay
- VectorVest AutoTester
- VectorVest Educational Services
- VectorVest OnLine
- VectorVest Options Analyzer
- VectorVest ProGraphics v6.0
- VectorVest ProTrader 7
- VectorVest RealTime Derby Tool
- VectorVest Simulator
- VectorVest Variator
- VectorVest Watchdog
- StockCharts.com, Inc.
- Candle Patterns
- Candlestick Charting Explained
- Intermarket Technical Analysis
- John Murphy on Chart Analysis
- John Murphy's Chart Pattern Recognition
- John Murphy's Market Message
- MurphyExplainsMarketAnalysis-Intermarket Analysis
- MurphyExplainsMarketAnalysis-Visual Analysis
- StockCharts.com
- Technical Analysis of the Financial Markets
- The Visual Investor
