HOT TOPICS LIST
- MACD
- Fibonacci
- RSI
- Gann
- ADXR
- Stochastics
- Volume
- Triangles
- Futures
- Cycles
- Volatility
- ZIGZAG
- MESA
- Retracement
- Aroon
INDICATORS LIST
LIST OF TOPICS
PRINT THIS ARTICLE
by Koos van der Merwe
A head and shoulder formation is pretty accurate in suggesting a target.
Position: Sell
Koos van der Merwe
Has been a technical analyst since 1969, and has worked as a futures and options trader with First Financial Futures in Johannesburg, South Africa.
PRINT THIS ARTICLE
HEAD & SHOULDERS
Looking At A Head And Shoulders
05/03/18 02:42:09 PMby Koos van der Merwe
A head and shoulder formation is pretty accurate in suggesting a target.
Position: Sell
| A head and shoulder pattern is very popular with traders because it does suggest a price target that the share or index can fall to. The pattern resembles an Elliott wave top, where a Wave 4 is formed, rises in a Wave 5 and then corrects in an ABC correction with wave C falling to the low. Because of this similarity, the head and shoulder pattern is taken seriously by many investors. Well, the index shown below is suggesting a future correction, and that is disturbing, bringing the bears out of the woods. |

|
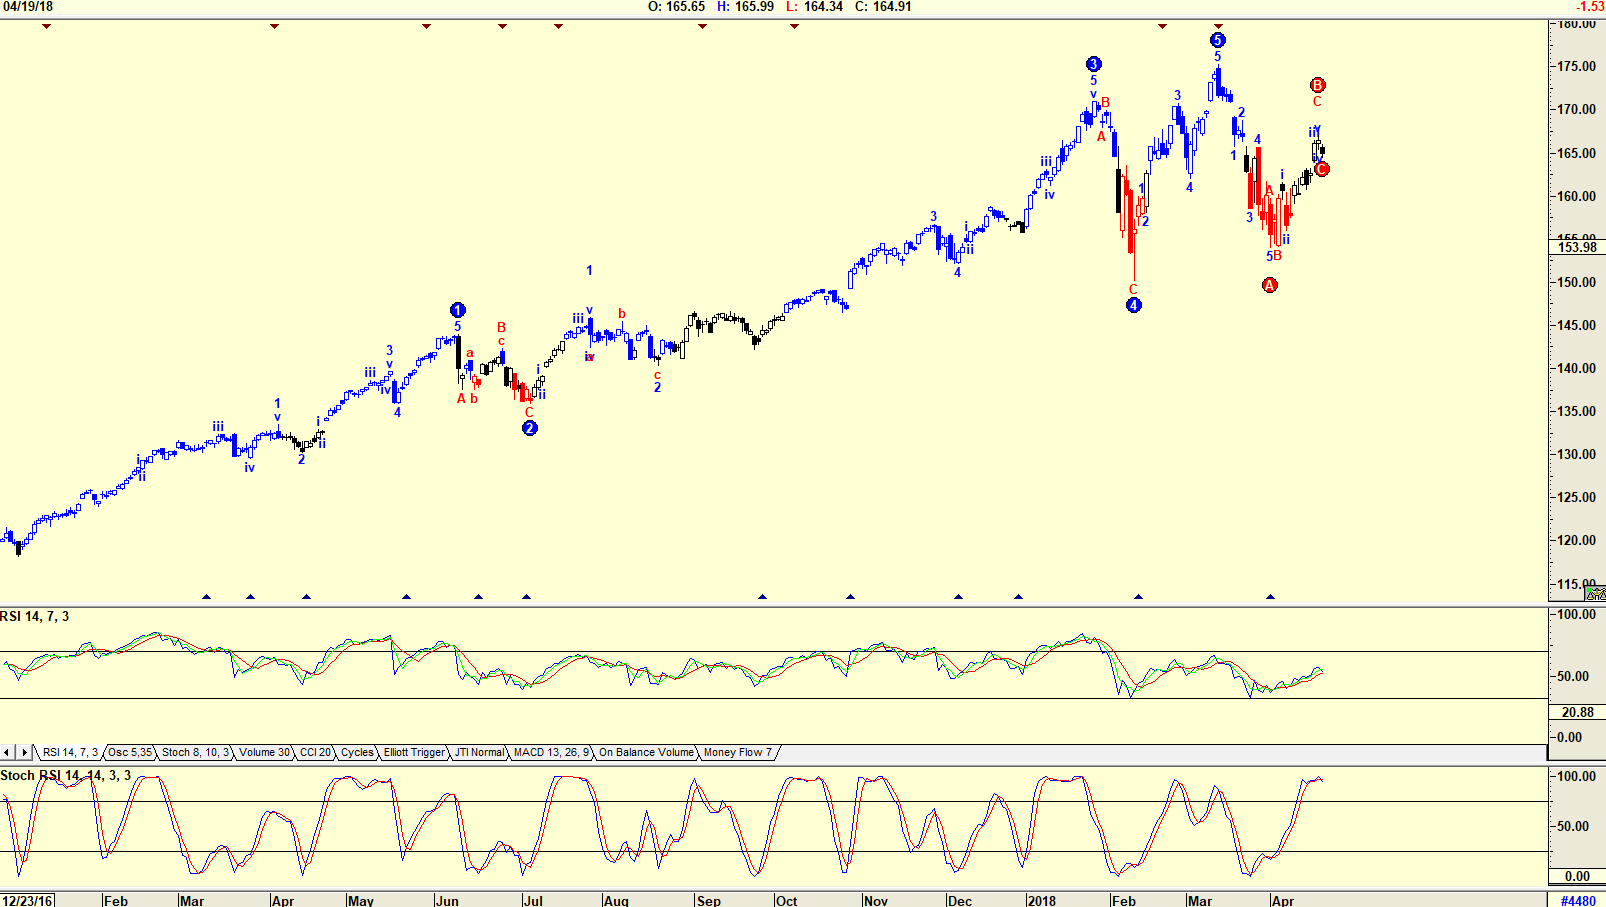
| Figure 1. Daily chart of the Nasdaq with an Elliot wave count. |
| Graphic provided by: AdvancedGET. |
| |
| The chart in Figure 1 is a daily chart of the Nasdaq 100 Index (QQQ) with an Advanced GET Elliott wave count suggesting that the index is tracing an ABC correction. The RSI index is trending upward, but the Stochastic RSI index is at overbought levels. Just looking at the chart, one can see that a head and shoulders pattern appears to be forming. |

|
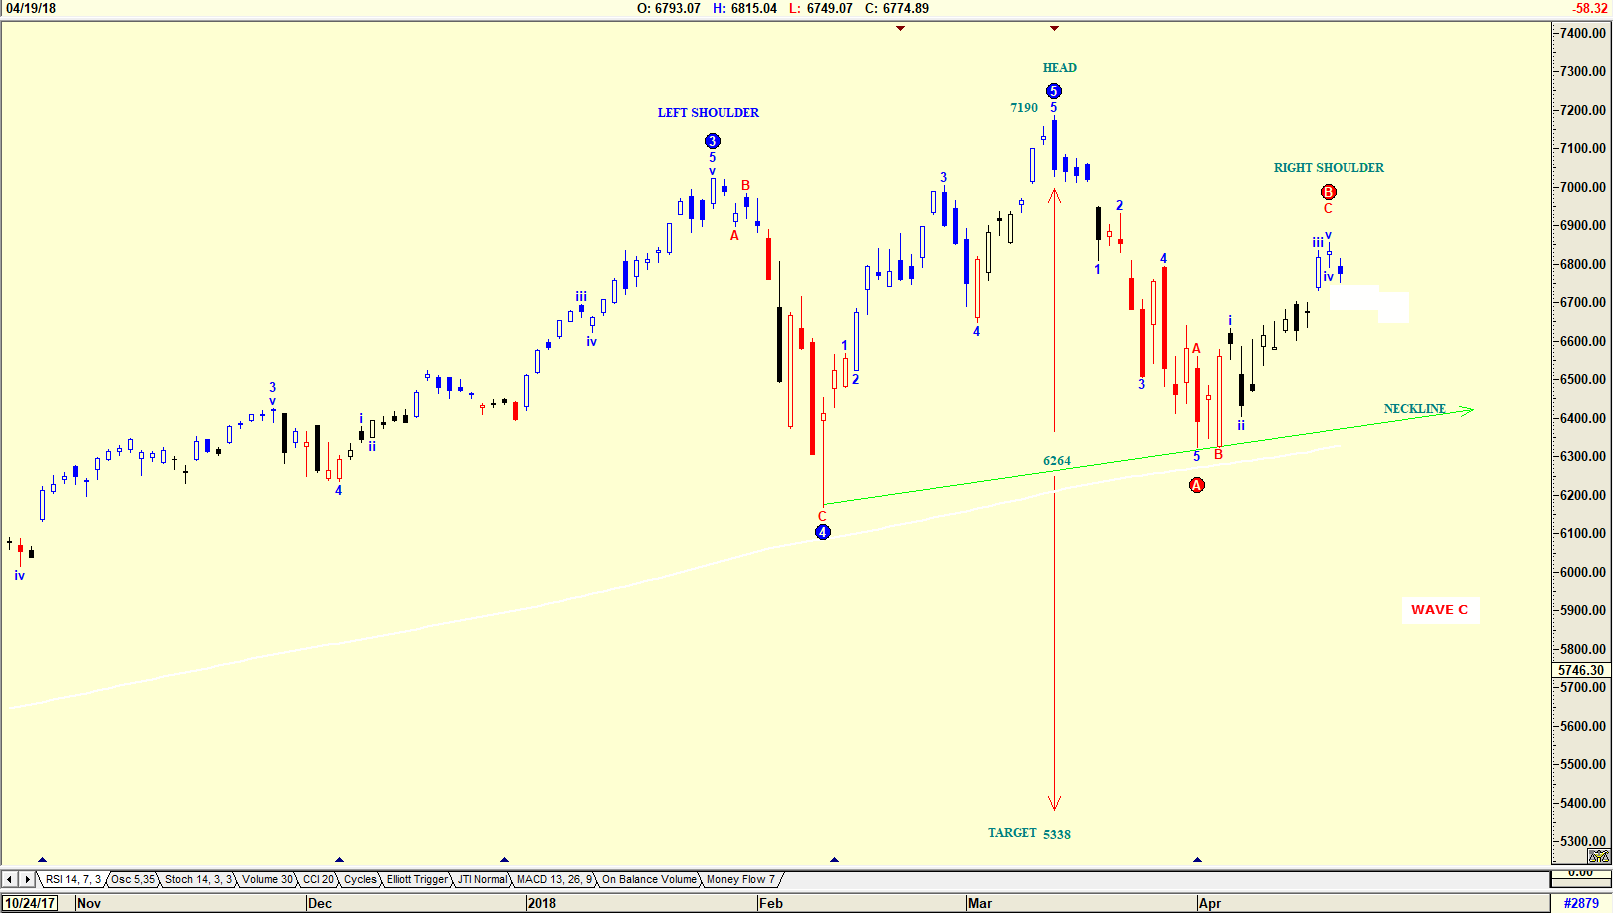
| Figure 2. The head and shoulders pattern on the QQQ Index. |
| Graphic provided by: AdvancedGET. |
| |
| The chart in Figure 2 is a chart showing the head and shoulders pattern that is forming on the Nasdaq index. The target suggested should the price fall below the rising neckline is 5338 (7190 - 6264 = 926. 6264 - 926 = 5338). Whether this pattern forms a head and shoulder pattern, the price depends very much on a fall in price in an Elliott wave C as shown on the chart. The WAVE C usually falls in a 5 wave pattern. |

|
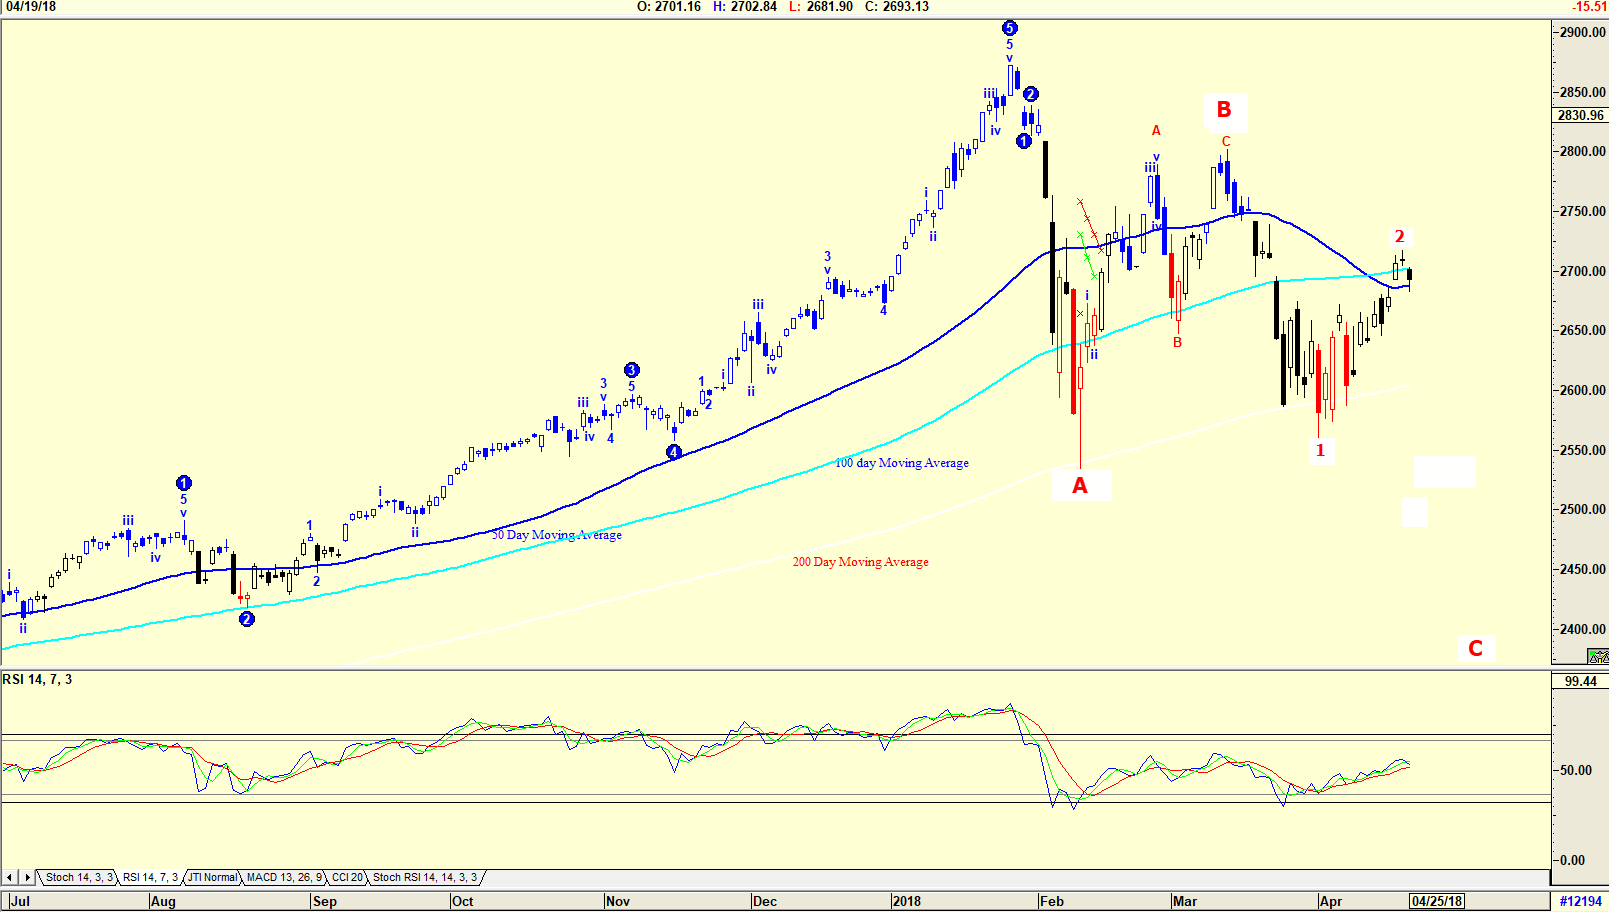
| Figure 3. The S&P500 Index with an Elliott wave count. |
| Graphic provided by: AdvancedGET. |
| |
| None of the other indexes, namely the Dow Jones or the S&P 500 show this head and shoulders pattern. They do, however, show that a WAVE 5 top has formed and that they are in an ABC correction. The chart in Figure 3 is a daily chart of the S&P 500, suggesting that the index is falling in a WAVE C. The chart shows that wave 1 of Wave C bounced off the 200-day moving average, and then again off the 100-day moving average. What the target will be for Wave 5 of WAVE C is a guess, because the RSI index is rising, suggesting a Wave 2 of WAVE C might not have topped. It is now May, and with school holidays in June, many investors could start sitting on the sidelines as they solidify their portfolios ahead of not watching the market while on holiday. The present uncertainty in America is also a concern. The phrase, "When in doubt, get out" is also starting to influence many traders and investors. The head and shoulder pattern suggested by the QQQ index could therefore be something to take seriously. |
Has been a technical analyst since 1969, and has worked as a futures and options trader with First Financial Futures in Johannesburg, South Africa.
| Address: | 3256 West 24th Ave |
| Vancouver, BC | |
| Phone # for sales: | 6042634214 |
| E-mail address: | petroosp@gmail.com |
Click here for more information about our publications!
PRINT THIS ARTICLE

|

Request Information From Our Sponsors
- StockCharts.com, Inc.
- Candle Patterns
- Candlestick Charting Explained
- Intermarket Technical Analysis
- John Murphy on Chart Analysis
- John Murphy's Chart Pattern Recognition
- John Murphy's Market Message
- MurphyExplainsMarketAnalysis-Intermarket Analysis
- MurphyExplainsMarketAnalysis-Visual Analysis
- StockCharts.com
- Technical Analysis of the Financial Markets
- The Visual Investor
- VectorVest, Inc.
- Executive Premier Workshop
- One-Day Options Course
- OptionsPro
- Retirement Income Workshop
- Sure-Fire Trading Systems (VectorVest, Inc.)
- Trading as a Business Workshop
- VectorVest 7 EOD
- VectorVest 7 RealTime/IntraDay
- VectorVest AutoTester
- VectorVest Educational Services
- VectorVest OnLine
- VectorVest Options Analyzer
- VectorVest ProGraphics v6.0
- VectorVest ProTrader 7
- VectorVest RealTime Derby Tool
- VectorVest Simulator
- VectorVest Variator
- VectorVest Watchdog
