HOT TOPICS LIST
- MACD
- Fibonacci
- RSI
- Gann
- ADXR
- Stochastics
- Volume
- Triangles
- Futures
- Cycles
- Volatility
- ZIGZAG
- MESA
- Retracement
- Aroon
INDICATORS LIST
LIST OF TOPICS
PRINT THIS ARTICLE
by Koos van der Merwe
With the present craziness in the stock market, having a list of shares to keep an eye on for a future buy is a must.
Position: Sell
Koos van der Merwe
Has been a technical analyst since 1969, and has worked as a futures and options trader with First Financial Futures in Johannesburg, South Africa.
PRINT THIS ARTICLE
TECHNICAL ANALYSIS
A Share To Keep An Eye On
04/26/18 04:29:55 PMby Koos van der Merwe
With the present craziness in the stock market, having a list of shares to keep an eye on for a future buy is a must.
Position: Sell
| The FBI raided the home and offices of President Trump's personal lawyer, Michael Cohen, who is now under criminal investigation. With the accusations of sexual assault and sexual harassment against the President; with House Speaker Paul Ryan announcing that he will not seek re-election and finally with the US, UK and France launching strikes against targets at three sites in Syria on Saturday morning, April 14, does anyone want to take the risk of buying shares in the stock market? Fears of a deteriorating relationship with China affected the stock market recently. The March employment report improved market sentiment, but that positive outlook did not last long. So, as an investor not a day trader, what do you do? My answer: prepare a list of stocks you would like to own, and buy on the dip. One stock to add to that list is CenturyLink Inc. CenturyLink Inc. is a struggling telecom company. In 2017 the company posted four straight earnings misses, struggling with declining consumer revenues and slammed by lawsuits regarding fraud in its billing. |

|
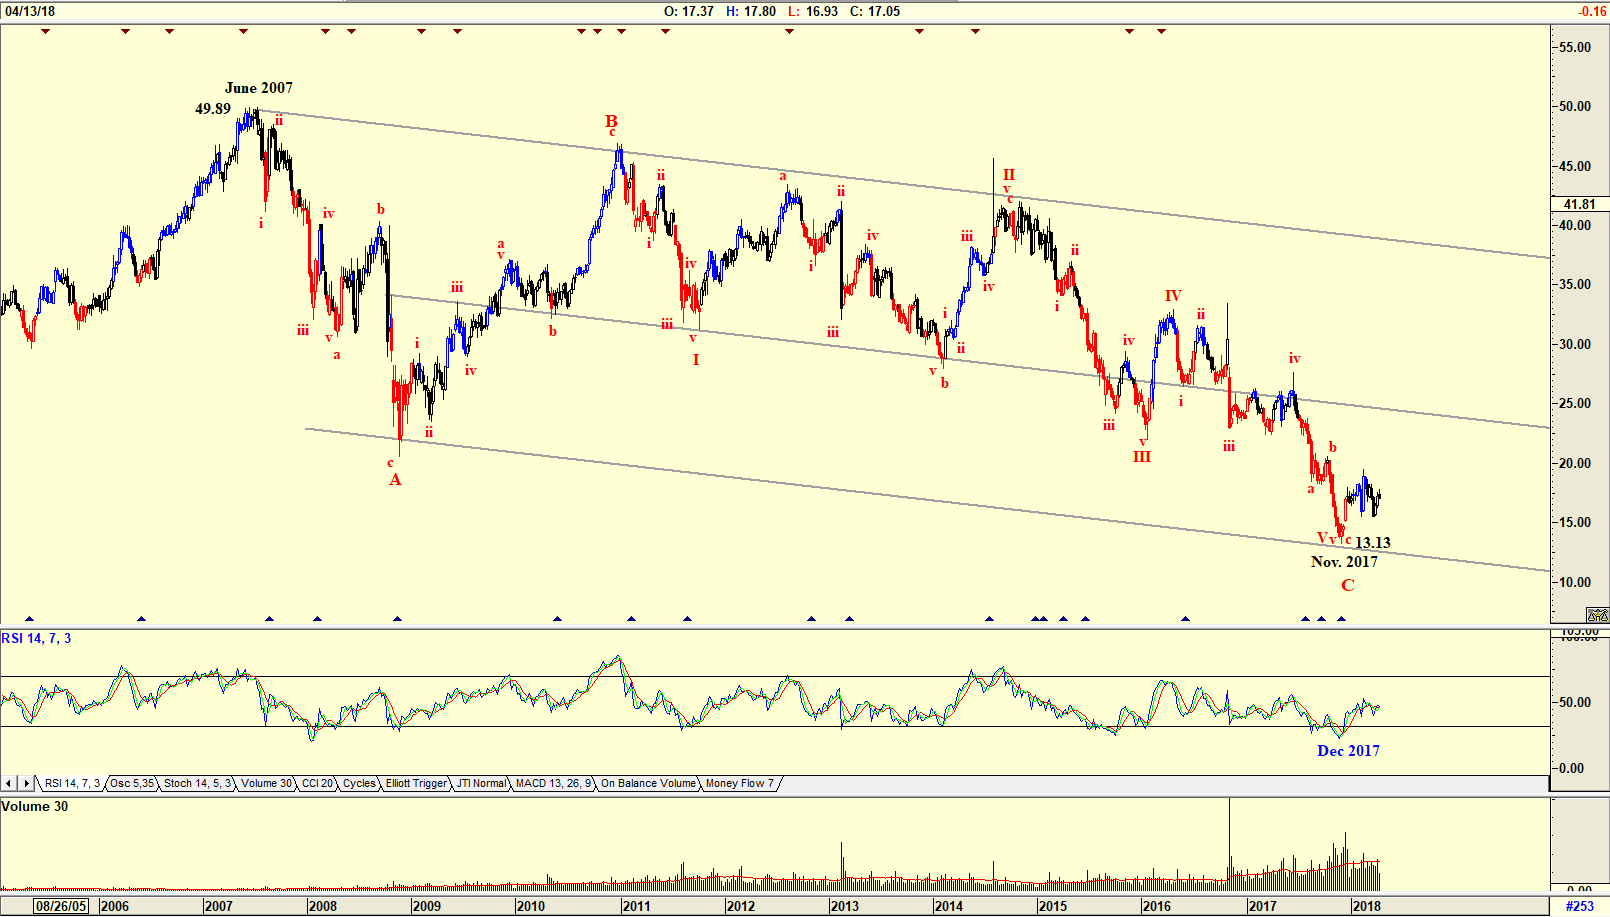
| Figure 1. Weekly chart with Elliot wave count. |
| Graphic provided by: AdvancedGET. |
| |
| The chart in Figure 1 is a weekly chart showing how the share price has fallen from a high of $49.89 in June 2007 to a low of $13.13 by November 2017. The Elliott wave count is a complicated count but it does suggest that the share price could be bottoming in a WAVE C. This is confirmed by the support given by the trend line and the RSI indicator which suggested a buy in December 2017. Do notice that volume has increased strongly as a buy signal was given, suggesting strength. |

|
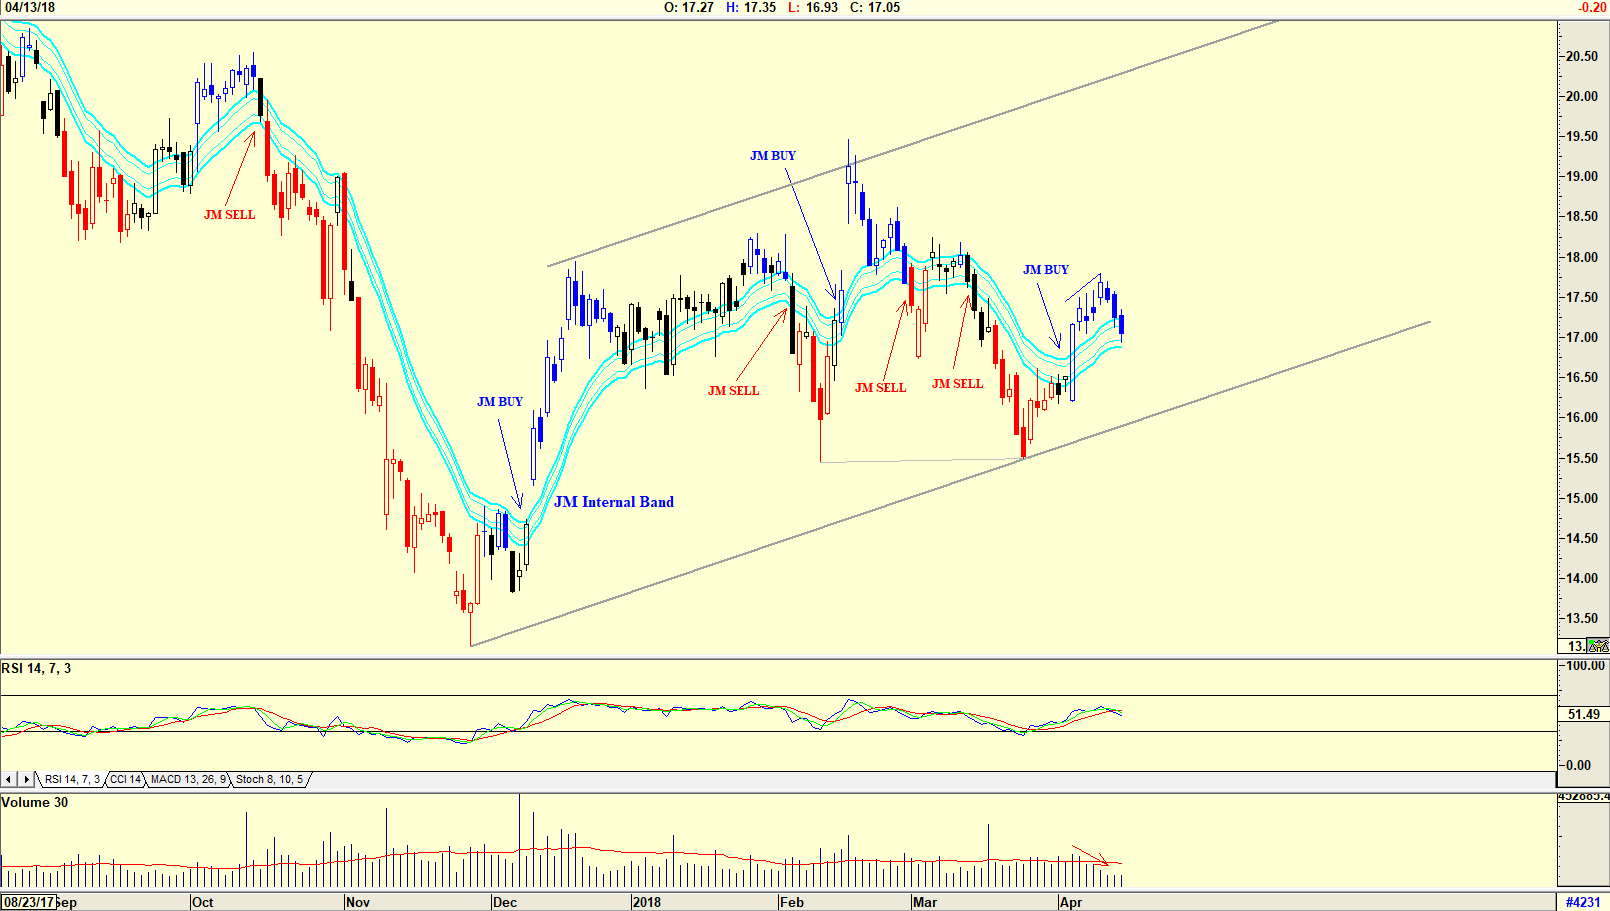
| Figure 2. Daily chart with JM Internal Band. |
| Graphic provided by: AdvancedGET. |
| |
| The chart in Figure 2 is a daily chart with a JM Internal Band. The JM Internal Band is a 15-period simple moving average offset by 2% positive and 2% negative. A move above the upper band suggests a buy and below the lower band a sell. With the share price presently testing the lower JM Internal Band, a sell signal could be in the offing. Do note that volume started falling as the share price rose after the JM buy signal, but that volume stabilized as the share fell recently. Rising volume with a rising price suggests strength. Falling volume with a rising price suggests weakness. Rising volume with a falling price suggests weakness. Falling volume with a falling price suggests strength. |

|
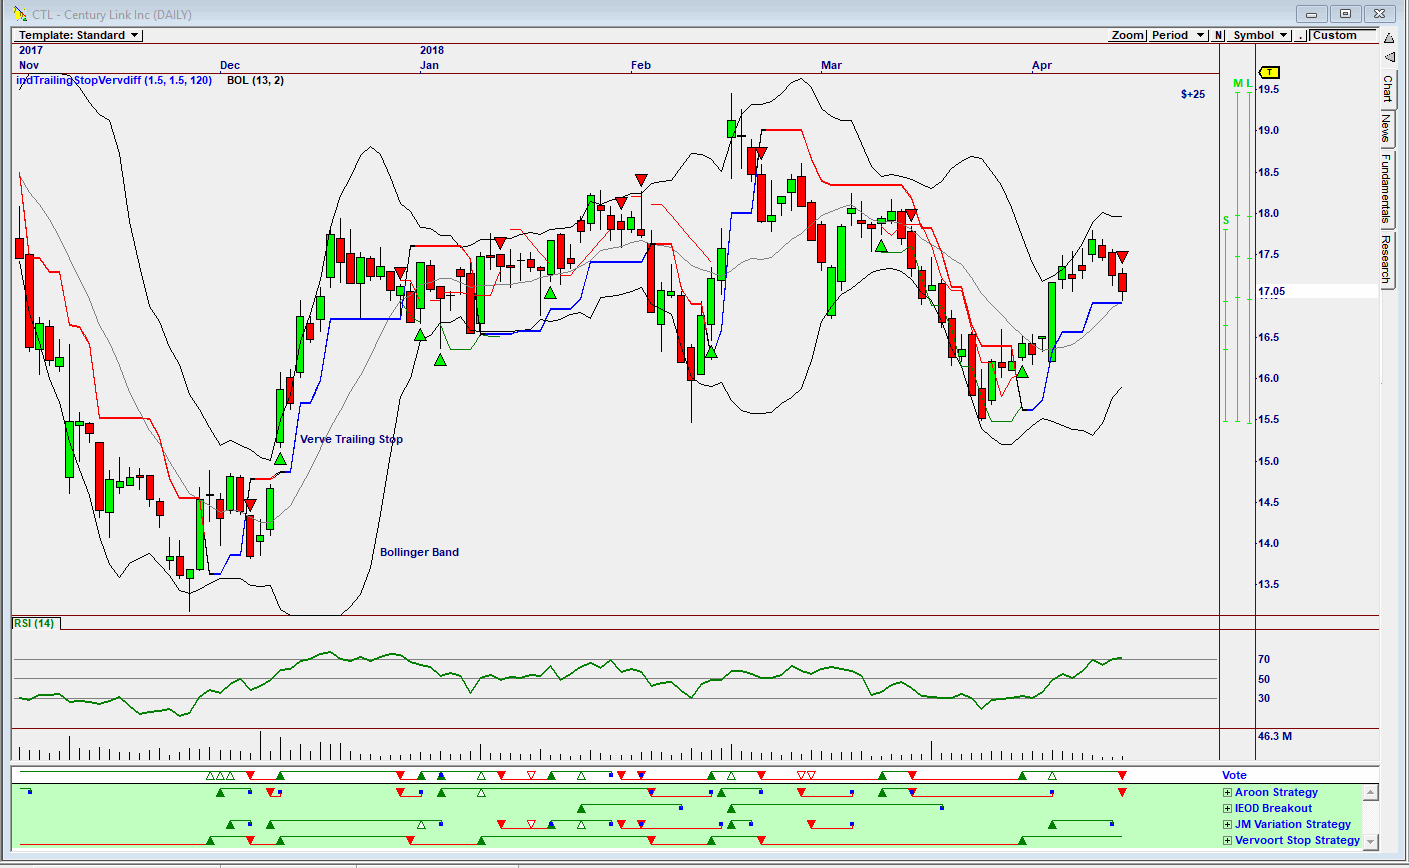
| Figure 3. Daily Omnitrader chart showing a sell. |
| Graphic provided by: Omnitrader. |
| |
| The chart in Figure 3 is a daily Omnitrader chart with the Vote line showing a sell signal given by the Aroon Strategy shown in green below the Vote line. The RSI Indicator shown is also approaching overbought levels, but has not yet suggested a sell. I would not be a buyer of CenturyLink at the moment. The market uncertainty, a result of the American political crises is shouting, "Wait and Watch'. Preparing a list of stocks that one would like to own once stability returns is becoming a must. |
Has been a technical analyst since 1969, and has worked as a futures and options trader with First Financial Futures in Johannesburg, South Africa.
| Address: | 3256 West 24th Ave |
| Vancouver, BC | |
| Phone # for sales: | 6042634214 |
| E-mail address: | petroosp@gmail.com |
Click here for more information about our publications!
PRINT THIS ARTICLE

Request Information From Our Sponsors
- VectorVest, Inc.
- Executive Premier Workshop
- One-Day Options Course
- OptionsPro
- Retirement Income Workshop
- Sure-Fire Trading Systems (VectorVest, Inc.)
- Trading as a Business Workshop
- VectorVest 7 EOD
- VectorVest 7 RealTime/IntraDay
- VectorVest AutoTester
- VectorVest Educational Services
- VectorVest OnLine
- VectorVest Options Analyzer
- VectorVest ProGraphics v6.0
- VectorVest ProTrader 7
- VectorVest RealTime Derby Tool
- VectorVest Simulator
- VectorVest Variator
- VectorVest Watchdog
- StockCharts.com, Inc.
- Candle Patterns
- Candlestick Charting Explained
- Intermarket Technical Analysis
- John Murphy on Chart Analysis
- John Murphy's Chart Pattern Recognition
- John Murphy's Market Message
- MurphyExplainsMarketAnalysis-Intermarket Analysis
- MurphyExplainsMarketAnalysis-Visual Analysis
- StockCharts.com
- Technical Analysis of the Financial Markets
- The Visual Investor
