HOT TOPICS LIST
- MACD
- Fibonacci
- RSI
- Gann
- ADXR
- Stochastics
- Volume
- Triangles
- Futures
- Cycles
- Volatility
- ZIGZAG
- MESA
- Retracement
- Aroon
INDICATORS LIST
LIST OF TOPICS
PRINT THIS ARTICLE
by Stella Osoba, CMT
Grand Theft Auto is arguably the most successful video game franchise in history. But its parent Take Two Interactive Software, Inc., recently completed a head and shoulders topping pattern. What's next for this stock?
Position: N/A
Stella Osoba, CMT
Stella Osoba is a trader and financial writer. She is a frequent contributor to "Technical Analysis of Stocks and Commodities" magazine and "Traders.com Advantage" as well as other financial publications.
PRINT THIS ARTICLE
TECHNICAL ANALYSIS
Grand Theft Auto's Parent
04/26/18 04:22:48 PMby Stella Osoba, CMT
Grand Theft Auto is arguably the most successful video game franchise in history. But its parent Take Two Interactive Software, Inc., recently completed a head and shoulders topping pattern. What's next for this stock?
Position: N/A
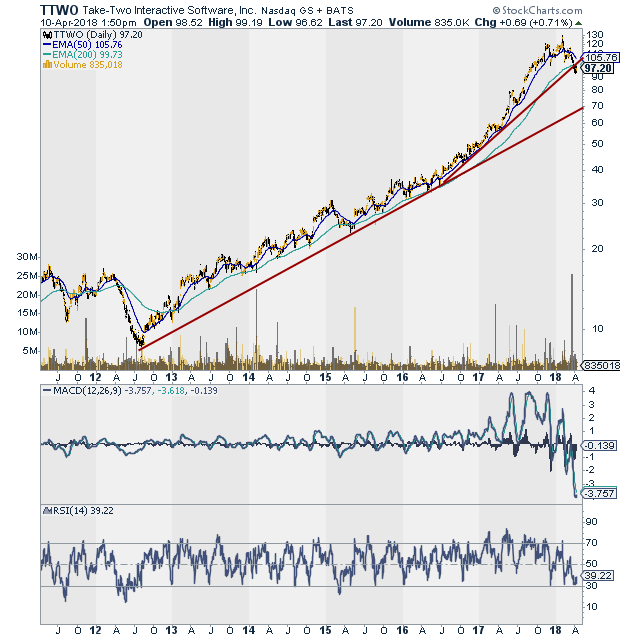
| Ever since touching its low of 7.37 on August 2, 2012, Take Two Interactive Software, Inc.(TTWO) has been in an extended uptrend while it went on a buying spree. Between 2005 and 2017, TTWO spent $80 million buying game developers. The stock price showed market approval with the stock as its price climbed. But the stock's recent completion of topping action may spell trouble ahead. |
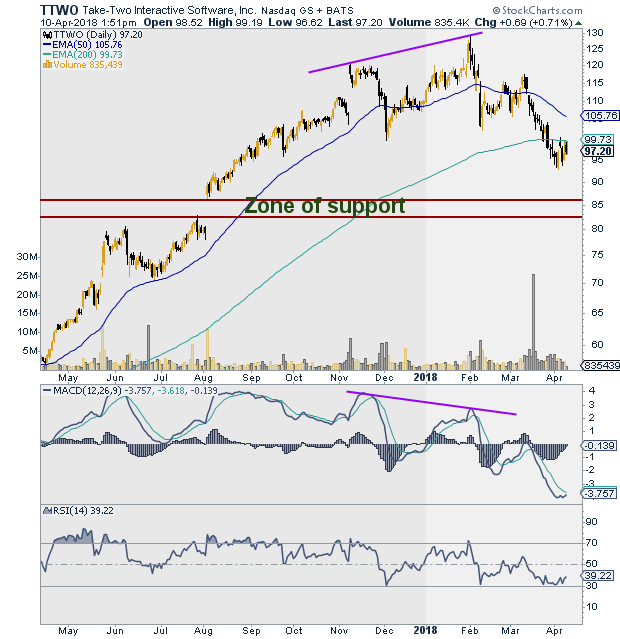
| On February, 1, 2018, TTWO reached a high of 129.25. A glance left at the long term weekly chart (see Figure 1) showed a chart that could do no wrong. The stock moved consistently upwards, with minor normal reactions along the way. It was easy to believe that this mid cap growth stock was destined for even higher prices. But in the stock market, trees don't grow to the skies. A look at the daily chart shows that 129.25 appears to be the peak of the head in a head and shoulders topping pattern. A lower peak to the left and the right of the head completed the pattern. |

|
| Figure 1. Daily chart for TTWO. |
| Graphic provided by: StockCharts.com. |
| |
| Head and shoulders patterns are bearish topping patterns which frequently fail. But when they do work, they can make for attractive trades. The high of the right shoulder rose to 116.58 on March 13, 2018 and then plunged with nose bleed speed to a low of 92.81 on April 4, 2018. This plunge took TTWO's price below its 200-day moving average. This could either be the completion of the price reaction or a pause in a new trend. |
| A gap up to test the 200-day moving average on April 5, 2018 failed, as a bearish candle with a long upper tail and small real body reversed to close under the 200-day MA, and resistance held. On April 6, the long bearish candle pointed to more pain ahead as another down leg might be in store for the stock. If TTWO continues to make lower lows, then support might be in the range of 86.10 to 82.55. |

|
| Figure 2. Head and shoulders pattern on daily chart of TTWO. |
| Graphic provided by: StockCharts.com. |
| |
| Signals from indicators such as the MACD can help confirm price signals. In this case, it was clear when price formed its high on February 1, 2018, that the MACD was not confirming (see chart). Price was making a higher high, while the MACD was not, suggesting new highs likely would not hold. A close below the most recent low of 92.81 points to further possible downside price action. But a close above the 200-day moving average may point to further upside action. The H&S pattern will be negated on a close above 116.62. Wait for a reversal signal and confirmation to make a decision about direction for a trade. |
Stella Osoba is a trader and financial writer. She is a frequent contributor to "Technical Analysis of Stocks and Commodities" magazine and "Traders.com Advantage" as well as other financial publications.
| E-mail address: | stellaosoba@gmail.com |
Click here for more information about our publications!
PRINT THIS ARTICLE

|

Request Information From Our Sponsors
- VectorVest, Inc.
- Executive Premier Workshop
- One-Day Options Course
- OptionsPro
- Retirement Income Workshop
- Sure-Fire Trading Systems (VectorVest, Inc.)
- Trading as a Business Workshop
- VectorVest 7 EOD
- VectorVest 7 RealTime/IntraDay
- VectorVest AutoTester
- VectorVest Educational Services
- VectorVest OnLine
- VectorVest Options Analyzer
- VectorVest ProGraphics v6.0
- VectorVest ProTrader 7
- VectorVest RealTime Derby Tool
- VectorVest Simulator
- VectorVest Variator
- VectorVest Watchdog
- StockCharts.com, Inc.
- Candle Patterns
- Candlestick Charting Explained
- Intermarket Technical Analysis
- John Murphy on Chart Analysis
- John Murphy's Chart Pattern Recognition
- John Murphy's Market Message
- MurphyExplainsMarketAnalysis-Intermarket Analysis
- MurphyExplainsMarketAnalysis-Visual Analysis
- StockCharts.com
- Technical Analysis of the Financial Markets
- The Visual Investor
