HOT TOPICS LIST
- MACD
- Fibonacci
- RSI
- Gann
- ADXR
- Stochastics
- Volume
- Triangles
- Futures
- Cycles
- Volatility
- ZIGZAG
- MESA
- Retracement
- Aroon
INDICATORS LIST
LIST OF TOPICS
PRINT THIS ARTICLE
by Stella Osoba, CMT
Deciding when to enter a position for a long trade can be confusing. Knowing what to look for in a healthy breakout can help.
Position: N/A
Stella Osoba, CMT
Stella Osoba is a trader and financial writer. She is a frequent contributor to "Technical Analysis of Stocks and Commodities" magazine and "Traders.com Advantage" as well as other financial publications.
PRINT THIS ARTICLE
TECHNICAL ANALYSIS
What A Breakout Looks Like?
04/19/18 04:03:04 PMby Stella Osoba, CMT
Deciding when to enter a position for a long trade can be confusing. Knowing what to look for in a healthy breakout can help.
Position: N/A
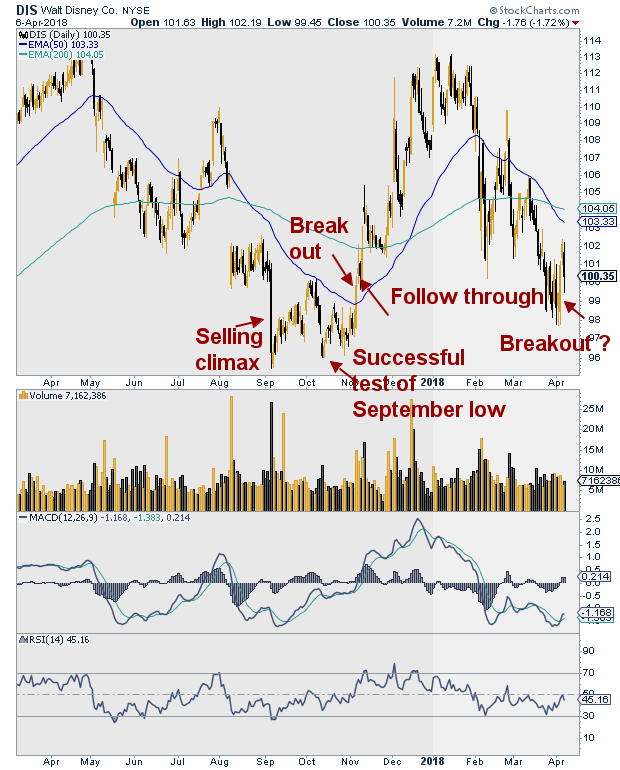
| After closing at a high of 114.32 on April 27, 2017, Walt Disney's (DIS) stock slumped. The decline took it to a low of 95.43 on September 7, 2017, when a long bearish candlestick suggested a selling climax. From there, the stock traded sideways, building a base. A successful test of the September lows on October 12, 2017 hinted at accumulation. The stock continued base building until later that same month when the lows began to get progressively higher. |
| On November 6, 2017, shares of DIS broke out. The candle that formed was a long bullish one and it neatly shot up, slicing above its 50-day moving average. |

|
| Figure 1. Daily chart for DIS. |
| Graphic provided by: StockCharts.com. |
| |
| How do we know this was the breakout? Because not only was the candle a strong bullish one, but volume confirmed this was a valid break out. We want to see breakout volume at two or three times the volume of the previous day. In this case, volume on the previous day was 5.4 million, on the day of the breakout, it had risen to 14.8 million, almost a threefold increase. This sort of volume tells us that the breakout is likely to be sustained. Also, the high on the day if the breakout was higher than the last high (see chart). It was 100.32 on November 6, 2017, the previous high was 100.17 on October, 9, 2017. These are the clues we look for to determine whether a trade is worth taking. |
| One final clue before we take the trade is to look for follow-through. Will the bullishness carry on into the next day? In this case it did, even though the candle that formed on November 7, 2017 was slightly bearish because it was a bull candle with a long upper tail and a small real body near the bottom of its trading range. It was indicative of selling pressure, probably representing those who had got caught in the August trading range (see Chart) relieved at being able to be made whole and getting out of the position. |
| As a comparison of what is likely to happen when volume does not support a breakout, look at what happened on April 4, 2018. A long bullish candle formed on volume that was only slightly above that of the day before, 8.7 million as opposed to 8.4 million. The jury is still out as to whether the stock will be able to find the buying pressure that it needs to sustain an upwards move. But in this volatile climate, I would prefer for everything to look right before I risked capital on a trade and this does not. |
Stella Osoba is a trader and financial writer. She is a frequent contributor to "Technical Analysis of Stocks and Commodities" magazine and "Traders.com Advantage" as well as other financial publications.
| E-mail address: | stellaosoba@gmail.com |
Click here for more information about our publications!
PRINT THIS ARTICLE

|

Request Information From Our Sponsors
- StockCharts.com, Inc.
- Candle Patterns
- Candlestick Charting Explained
- Intermarket Technical Analysis
- John Murphy on Chart Analysis
- John Murphy's Chart Pattern Recognition
- John Murphy's Market Message
- MurphyExplainsMarketAnalysis-Intermarket Analysis
- MurphyExplainsMarketAnalysis-Visual Analysis
- StockCharts.com
- Technical Analysis of the Financial Markets
- The Visual Investor
- VectorVest, Inc.
- Executive Premier Workshop
- One-Day Options Course
- OptionsPro
- Retirement Income Workshop
- Sure-Fire Trading Systems (VectorVest, Inc.)
- Trading as a Business Workshop
- VectorVest 7 EOD
- VectorVest 7 RealTime/IntraDay
- VectorVest AutoTester
- VectorVest Educational Services
- VectorVest OnLine
- VectorVest Options Analyzer
- VectorVest ProGraphics v6.0
- VectorVest ProTrader 7
- VectorVest RealTime Derby Tool
- VectorVest Simulator
- VectorVest Variator
- VectorVest Watchdog
