HOT TOPICS LIST
- MACD
- Fibonacci
- RSI
- Gann
- ADXR
- Stochastics
- Volume
- Triangles
- Futures
- Cycles
- Volatility
- ZIGZAG
- MESA
- Retracement
- Aroon
INDICATORS LIST
LIST OF TOPICS
PRINT THIS ARTICLE
by Koos van der Merwe
Marijuana is no longer the underground drug that can only be bought on street corners from criminals. It has become a viable industry.
Position: Accumulate
Koos van der Merwe
Has been a technical analyst since 1969, and has worked as a futures and options trader with First Financial Futures in Johannesburg, South Africa.
PRINT THIS ARTICLE
TECHNICAL ANALYSIS
A Look At Canadian Marijuana Stocks
04/26/18 04:16:42 PMby Koos van der Merwe
Marijuana is no longer the underground drug that can only be bought on street corners from criminals. It has become a viable industry.
Position: Accumulate
| With the trade war hoopla dominating Wall Street, the marijuana industry is so far insulated from the drama. However, the weed market is becoming tempting as Canada prepares to legalize recreational marijuana. Canada's five largest publicly traded marijuana companies are each valued at over C$1 billion. When recreational pot gets the final green light in Canada, it won't be an entirely free market as anticipated. Provinces like Ontario and Quebec will only sell weed through government stores. Investing in weed stocks is risky just like any other stocks. So, what do the charts tell us? |

|
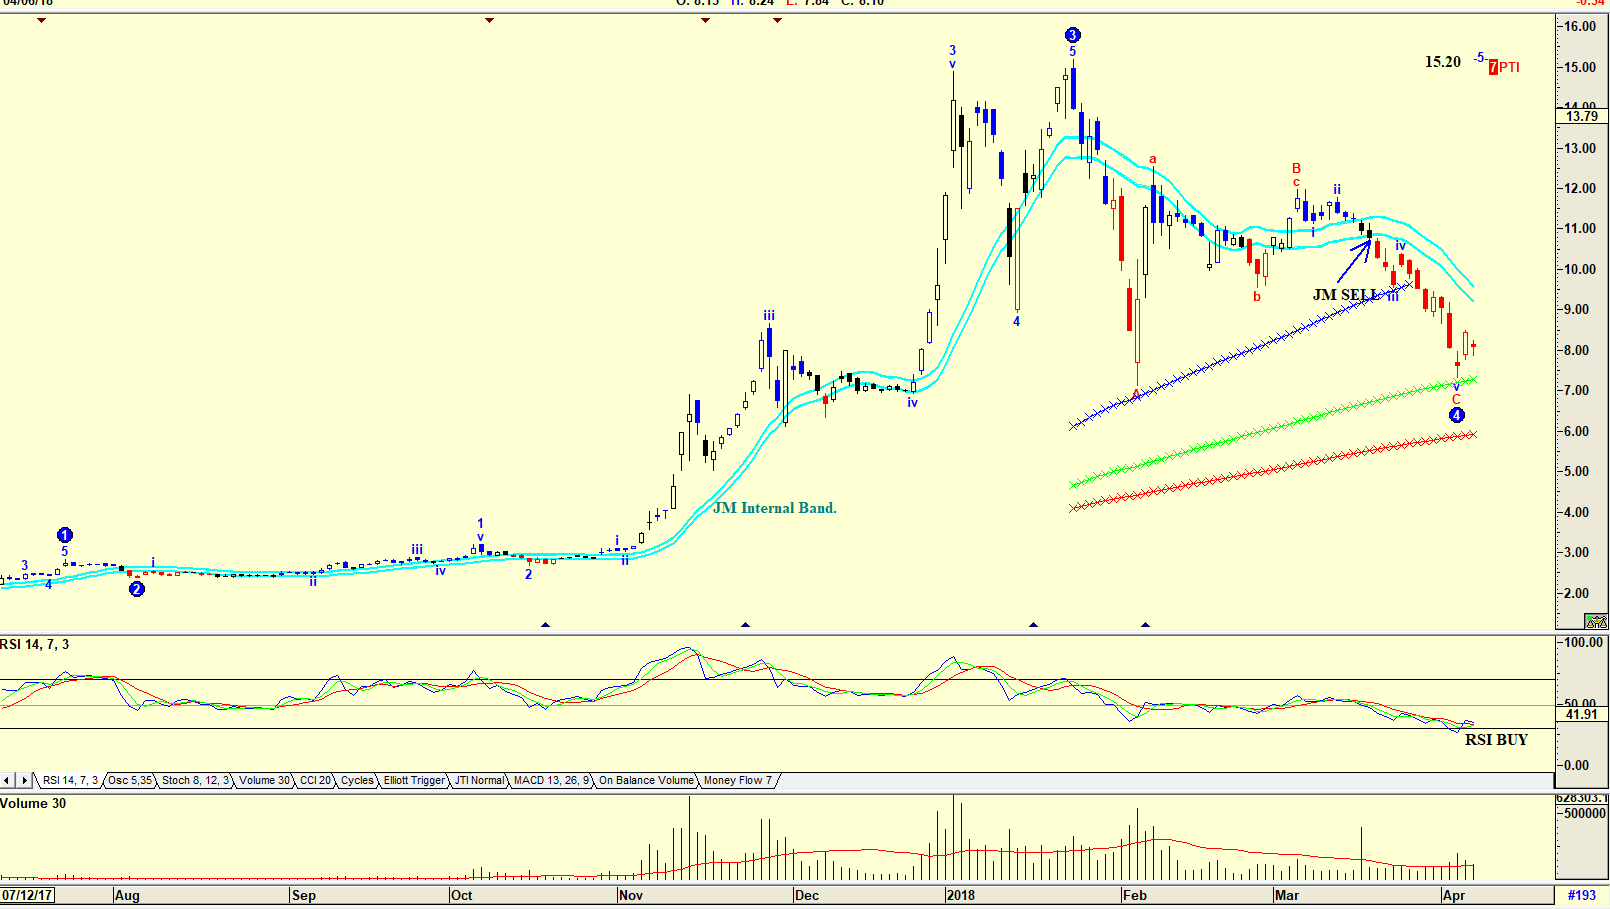
| Figure 1. Aurira Cannabis. |
| Graphic provided by: AdvancedGET. |
| |
| The chart in Figure 1 is a daily chart of Aurora Cannabis. The Elliott wave count suggests that the share price is tracing a WAVE 4 and could start rising in a WAVE 5. This is confirmed by the RSI indicator which has given a buy signal. However, the PTI (Probability Index) is 7, which is very low, suggesting that the share price will probably not rise to $15.20. Volume, however, was lower as the price fell on April 6, also suggesting strength. The Expert Trend locator also has the bars colored red, which suggests weakness. Conservative investors should only buy the stock when and if the share price moves above the upper band of the JM Internal Band. The JM Internal Band is a 15-period simple moving average offset by 2% plus and 2% minus. A move above the upper band is a buy. |

|
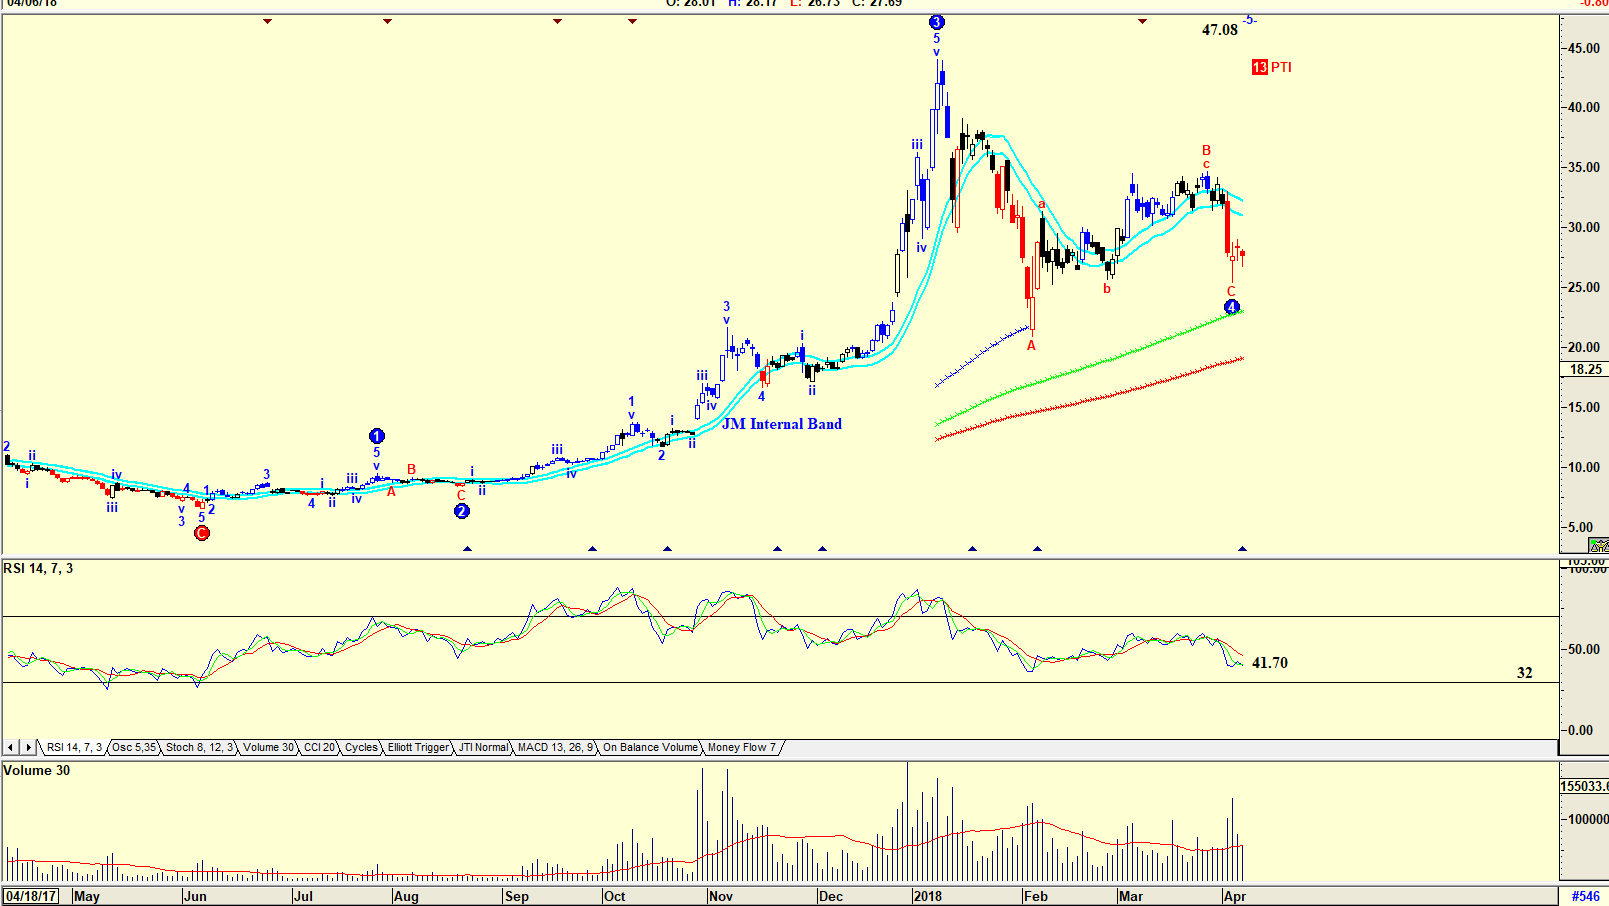
| Figure 2. Canopy Growth Corp. |
| Graphic provided by: AdvancedGET. |
| |
| Canopy Growth Corp, the daily chart in Figure 2, is also suggesting a Wave 4 Elliott wave count. The PTI is only 13, once again not suggesting a rise to the Wave 5 of $47.08. The Expert Trend locator again has the bars in red, suggesting weakness. The RSI indicator at 41.70 has not given a buy signal. This will only be given should the indicator drop below the 32-horizontal line and then rise above it. The share price is also well below the lower JM Internal Band. Do note that volume has fallen as the share price fell, suggesting possible future strength. |

|
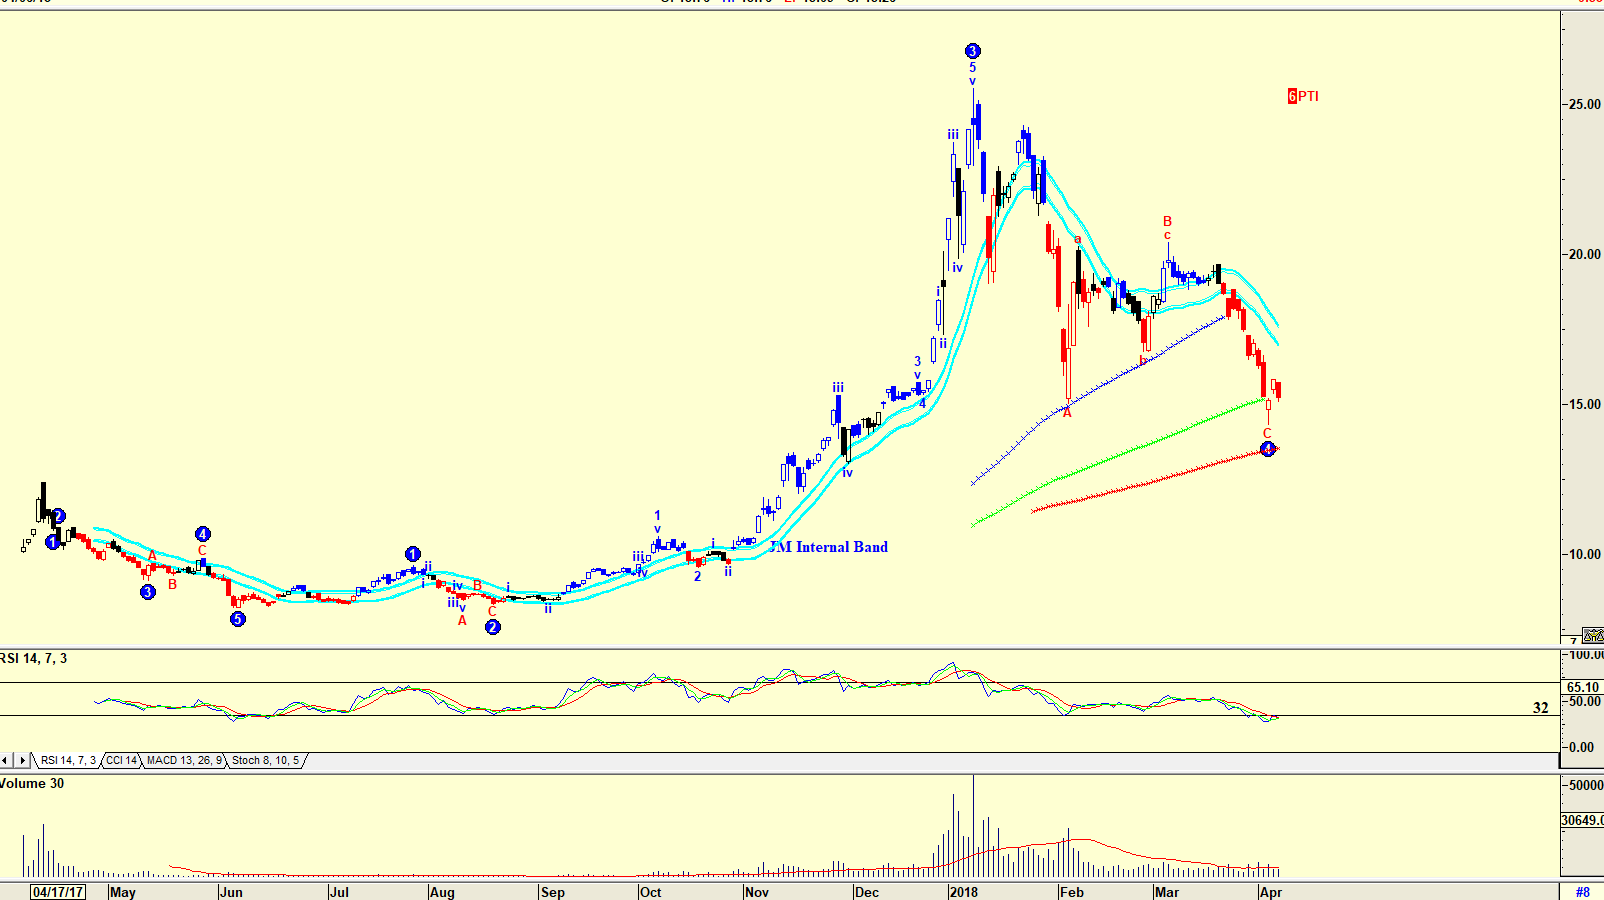
| Figure 3. Horizon Cannabis. |
| Graphic provided by: AdvancedGET. |
| |
| The share in Figure 3 is another Canadian cannabis stock, Horizon Cannabis. Once again the Elliott wave count is suggesting that the share price is tracing a WAVE 4. The Expert Trend locator has the bars in red and volume is once again low as the price fell. The PTI at 6 suggests that the rise, when it comes, should be weak. The RSI indicator has not broken above the 32-horizontal line to suggest a buy. Canada's marijuana industry has a current stock market value of around C$30 billion. Critics say that cannabis bulls are underestimating the effect of a pot glut, and are ignoring the lessons one could learn from Colorado and Washington, two states in the U.S. where recreational marijuana was legalized in recent years, and saw retail prices plummet. Caution, therefore, is a must, and a buyer should prefer to wait for a move above the upper line of the JM Internal Band indicator before buying a stock. |
Has been a technical analyst since 1969, and has worked as a futures and options trader with First Financial Futures in Johannesburg, South Africa.
| Address: | 3256 West 24th Ave |
| Vancouver, BC | |
| Phone # for sales: | 6042634214 |
| E-mail address: | petroosp@gmail.com |
Click here for more information about our publications!
PRINT THIS ARTICLE

Request Information From Our Sponsors
- StockCharts.com, Inc.
- Candle Patterns
- Candlestick Charting Explained
- Intermarket Technical Analysis
- John Murphy on Chart Analysis
- John Murphy's Chart Pattern Recognition
- John Murphy's Market Message
- MurphyExplainsMarketAnalysis-Intermarket Analysis
- MurphyExplainsMarketAnalysis-Visual Analysis
- StockCharts.com
- Technical Analysis of the Financial Markets
- The Visual Investor
- VectorVest, Inc.
- Executive Premier Workshop
- One-Day Options Course
- OptionsPro
- Retirement Income Workshop
- Sure-Fire Trading Systems (VectorVest, Inc.)
- Trading as a Business Workshop
- VectorVest 7 EOD
- VectorVest 7 RealTime/IntraDay
- VectorVest AutoTester
- VectorVest Educational Services
- VectorVest OnLine
- VectorVest Options Analyzer
- VectorVest ProGraphics v6.0
- VectorVest ProTrader 7
- VectorVest RealTime Derby Tool
- VectorVest Simulator
- VectorVest Variator
- VectorVest Watchdog
