HOT TOPICS LIST
- MACD
- Fibonacci
- RSI
- Gann
- ADXR
- Stochastics
- Volume
- Triangles
- Futures
- Cycles
- Volatility
- ZIGZAG
- MESA
- Retracement
- Aroon
INDICATORS LIST
LIST OF TOPICS
PRINT THIS ARTICLE
by Koos van der Merwe
In a previous article (Anyone For Gold?" Oct. 29, 2002), I looked at the Amex Gold Bugs Index ($HUI) and argued that the index is forming a triangle that could break out upwards by about 91%. In spite of this analysis, I still cannot become enthusiastic about gold, and here is why.
Position: Hold
Koos van der Merwe
Has been a technical analyst since 1969, and has worked as a futures and options trader with First Financial Futures in Johannesburg, South Africa.
PRINT THIS ARTICLE
STOCHASTICS
Gold Anyone? Cup and Handle Formations Say No
12/16/02 10:22:25 AMby Koos van der Merwe
In a previous article (Anyone For Gold?" Oct. 29, 2002), I looked at the Amex Gold Bugs Index ($HUI) and argued that the index is forming a triangle that could break out upwards by about 91%. In spite of this analysis, I still cannot become enthusiastic about gold, and here is why.
Position: Hold
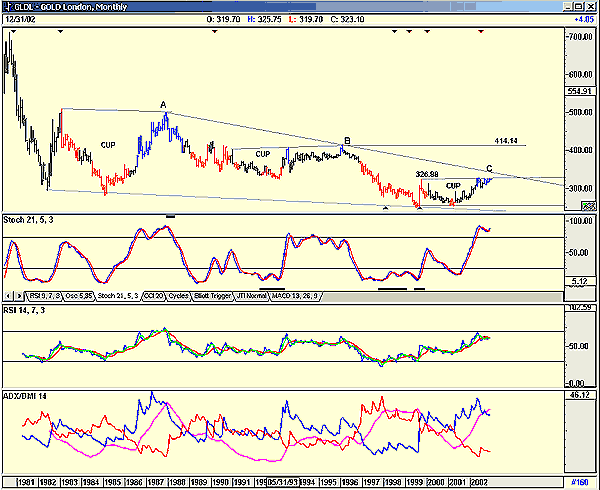
| Shown below is a monthly chart of the London PM gold price going back 20 years to 1981. I have marked the formation of three cup and handle patterns. The first formation at 'A', looked promising except that the three indicators shown-- a 21, 5, 3 stochastic indicator, a 14, 7, 3 RSI indicator, and an ADX/DMI 14 indicator-- were all suggesting negativity. The two former indicators were both overbought, and the latter suggested a change of direction as the positive (blue) and negative (red) ADX lines had diverged appreciably, with the positive above the negative line, suggesting a negative reversal. The DMI line (maroon) was also at a high and looking toppy. |
| The second cup and handle formation, indicated by a 'B' in the chart also failed, with the indicators in similar negative positions to "A." |

|
| London PM gold price, monthly chart. |
| Graphic provided by: AdvancedGET. |
| |
| Currently, a cup and handle formation has developed at "C." The stochastic indicator is overbought, the RSI indicator could be overbought, but is not above the 70 parameter (which could be suspect), and the ADX/DMI indicator has the ADX lines at an extreme distance from each other with the DMI line at topping levels, ready to turn down. |
| 'Once bitten twice shy,' as the saying goes, the two previous cup and handle patterns failed, which means that the possibility of failure for the third time, is very real. However, there is always the exception, and as I argued in my article on October 29th, the triangle which formed on the daily chart of the Amex Gold Bugs Index, looks bullish. This triangle is still forming (you can see the formation of a small triangle in the chart) as investors consolidate their holdings of gold assets in the event the US invades Iraq. Monthly gold however, doesn't seem to have reacted yet, so I would still keep my options open. |
| Any break above the resistance level of $326.88 will see gold rise to $414.14. This will certainly mean war with Iraq, or some other catastrophic world event. Let us hope that the selloff, as suggested by the indicators in the chart, occur. |
Has been a technical analyst since 1969, and has worked as a futures and options trader with First Financial Futures in Johannesburg, South Africa.
| Address: | 3256 West 24th Ave |
| Vancouver, BC | |
| Phone # for sales: | 6042634214 |
| E-mail address: | petroosp@gmail.com |
Click here for more information about our publications!
Comments
Date: 12/17/02Rank: 3Comment:
Date: 12/17/02Rank: 4Comment: You left this out of your scenario. Unlike the first two cups this latest cup had a double bottom within that formation at 250 and 260 respectively. Not only that but there was massive negative divergence in all indicators between those two bottoms which can also be seen in the monthly chart as well.
Date: 12/17/02Rank: 4Comment: I might also want to add that the bottom symetry of this cup is superior to the other two cups. Also the handle of this cup is superior as well having happened to form a perfect symetrical triangle. The first two cups handles are characterized by jerky downward moves which have a tendency to fail. The moral of the story is not all cups are created equal regardless of the indicators.
Date: 12/18/02Rank: 5Comment:

Request Information From Our Sponsors
- StockCharts.com, Inc.
- Candle Patterns
- Candlestick Charting Explained
- Intermarket Technical Analysis
- John Murphy on Chart Analysis
- John Murphy's Chart Pattern Recognition
- John Murphy's Market Message
- MurphyExplainsMarketAnalysis-Intermarket Analysis
- MurphyExplainsMarketAnalysis-Visual Analysis
- StockCharts.com
- Technical Analysis of the Financial Markets
- The Visual Investor
- VectorVest, Inc.
- Executive Premier Workshop
- One-Day Options Course
- OptionsPro
- Retirement Income Workshop
- Sure-Fire Trading Systems (VectorVest, Inc.)
- Trading as a Business Workshop
- VectorVest 7 EOD
- VectorVest 7 RealTime/IntraDay
- VectorVest AutoTester
- VectorVest Educational Services
- VectorVest OnLine
- VectorVest Options Analyzer
- VectorVest ProGraphics v6.0
- VectorVest ProTrader 7
- VectorVest RealTime Derby Tool
- VectorVest Simulator
- VectorVest Variator
- VectorVest Watchdog
