HOT TOPICS LIST
- MACD
- Fibonacci
- RSI
- Gann
- ADXR
- Stochastics
- Volume
- Triangles
- Futures
- Cycles
- Volatility
- ZIGZAG
- MESA
- Retracement
- Aroon
INDICATORS LIST
LIST OF TOPICS
PRINT THIS ARTICLE
Facebook
04/19/18 03:57:16 PM
by Koos van der Merwe
With the Facebook drama highlighting the news the past few weeks, when is it time to start buying the share?
Position: Accumulate
Koos van der Merwe
Has been a technical analyst since 1969, and has worked as a futures and options trader with First Financial Futures in Johannesburg, South Africa.
PRINT THIS ARTICLE
TECHNICAL ANALYSIS
by Koos van der Merwe
With the Facebook drama highlighting the news the past few weeks, when is it time to start buying the share?
Position: Accumulate
| The news has been full of the story how fake news that appeared in various adverts on Facebook may have influenced the American 2016 election. Today, Facebook is fighting and disabling fake accounts at the point of creation and before they can do any harm. The problem, of course, is identifying them. Mark Zuckerberg, the founder of Facebook, has announced that the company is taking measures to protect people's personal data, given reports that Cambridge Analytica may still be in possession of user data that was obtained improperly, targeting voters in the 2016 US election. Mark Zuckerberg has stated, "We have a responsibility to protect your data, and if we can't then we don't deserve to serve you." The share price of Facebook has dropped strongly over the past few weeks. One should not forget that Facebook has brought groups of people from all over the world together. Keeping in touch with friends and family, expressing opinion about political uncertainty and above all, making new friends is very much a Facebook plus. So, when is the time to start buying Facebook's shares again? |

|
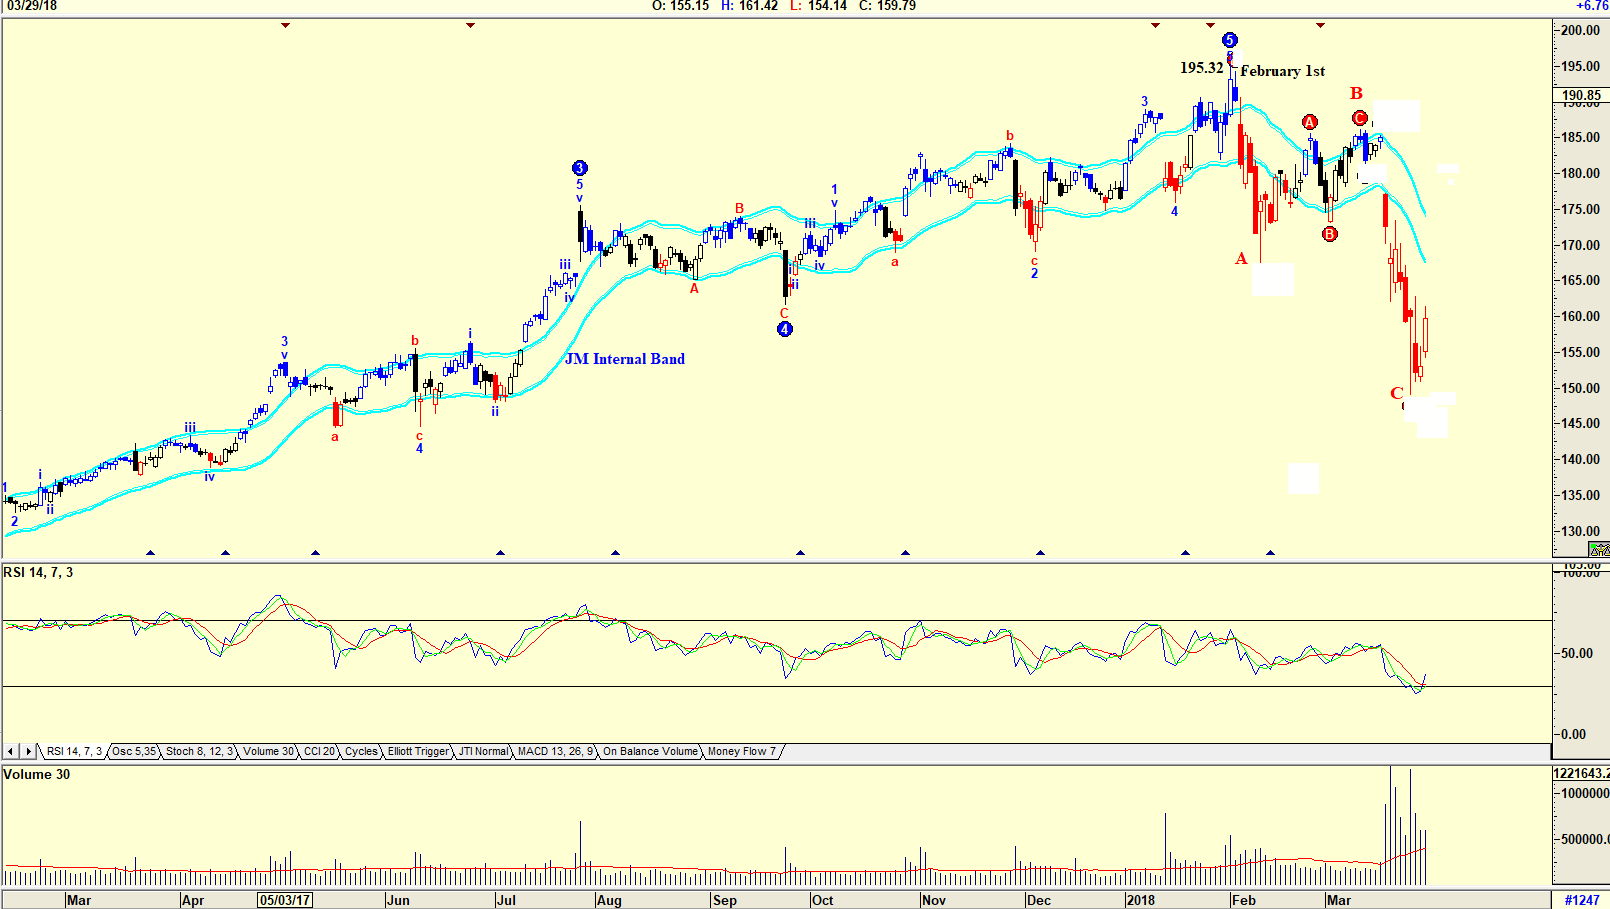
| Figure 1. Daily Chart. |
| Graphic provided by: AdvancedGET. |
| |
| The chart in Figure 1 is a daily chart of Facebook with an Elliott wave count, showing how the price started correcting after reaching a high of 195.32 on January 31 in a WAVE 5. The share then corrected in an ABC correction to a low of $149.02 by March 26 before starting to rise. Is it now time to buy the share? The RSI indicator says "yes." However, do note that volume rose strongly as the share price fell, but it has not risen as strongly as the share price corrected upwards suggesting uncertainty. Waiting for a rise above the JM Internal Band could be the way to go for conservative investors. The JM Internal Band, which is a 15-period simple moving average offset by 2% positive and 2% negative. A move above the upper band suggests a buy and below the lower band a sell. |

|
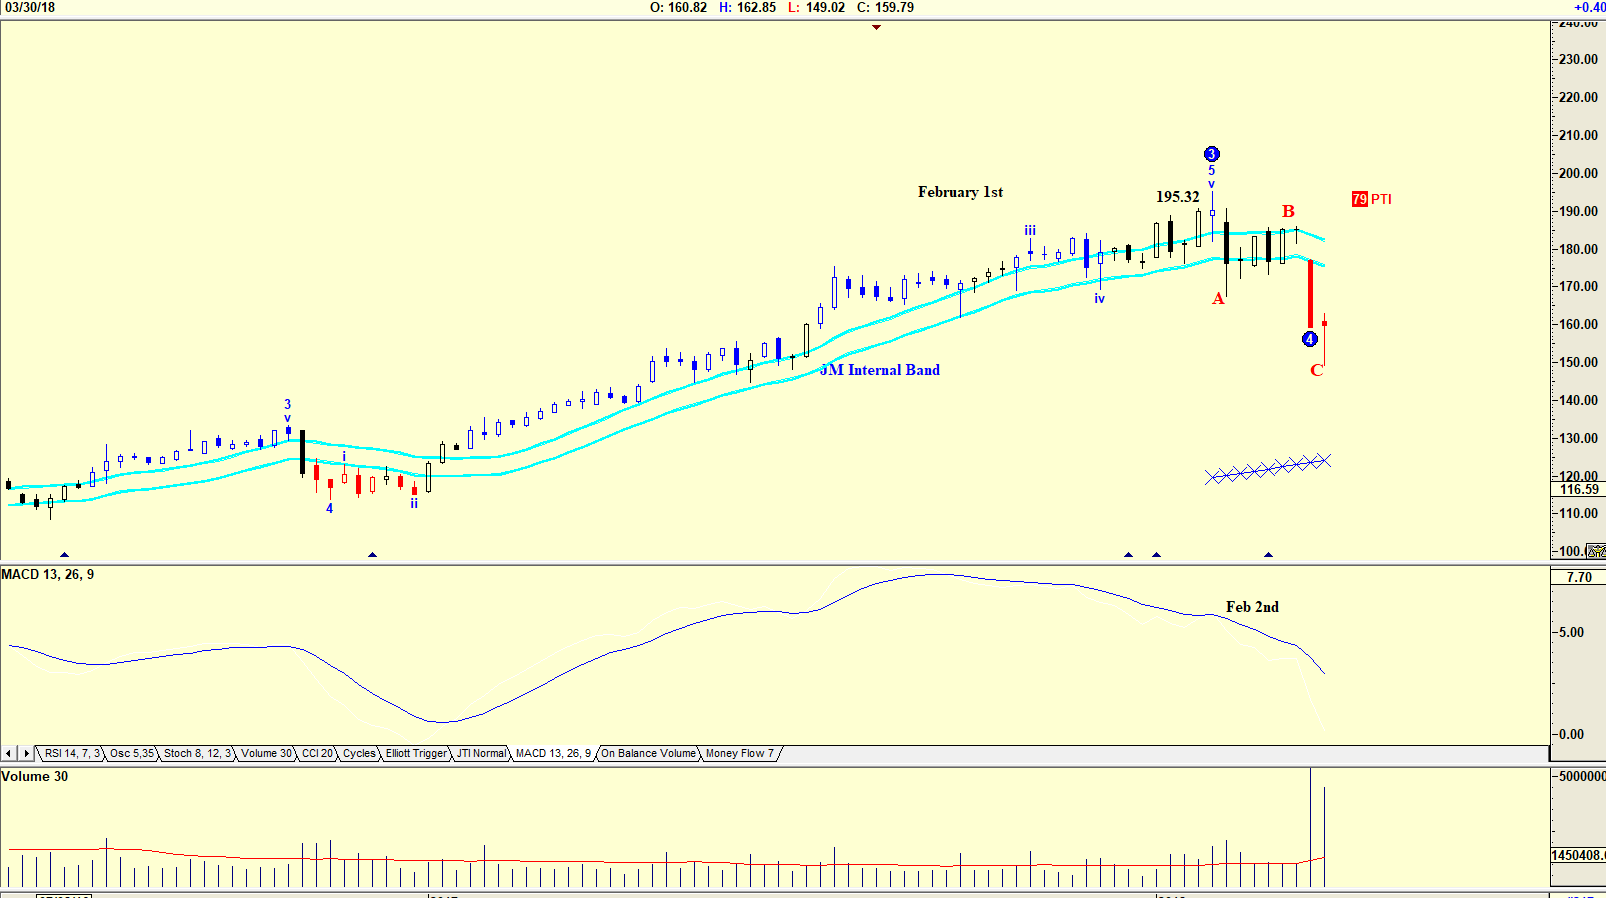
| Figure 2. Weekly Chart. |
| Graphic provided by: AdvancedGET. |
| |
| The chart in Figure 2 is a weekly chart with an Elliott wave count suggesting that the share price has fallen in a WAVE 4. The PTI (Probability Index) is suggesting a 79% probability that the share price will rise in a WAVE 5 above the price of 195.32. The WAVE 5 high not shown on the chart is $257. Do note the MACD indicator that gave a sell signal on February 2 and is still in sell mode. |

|
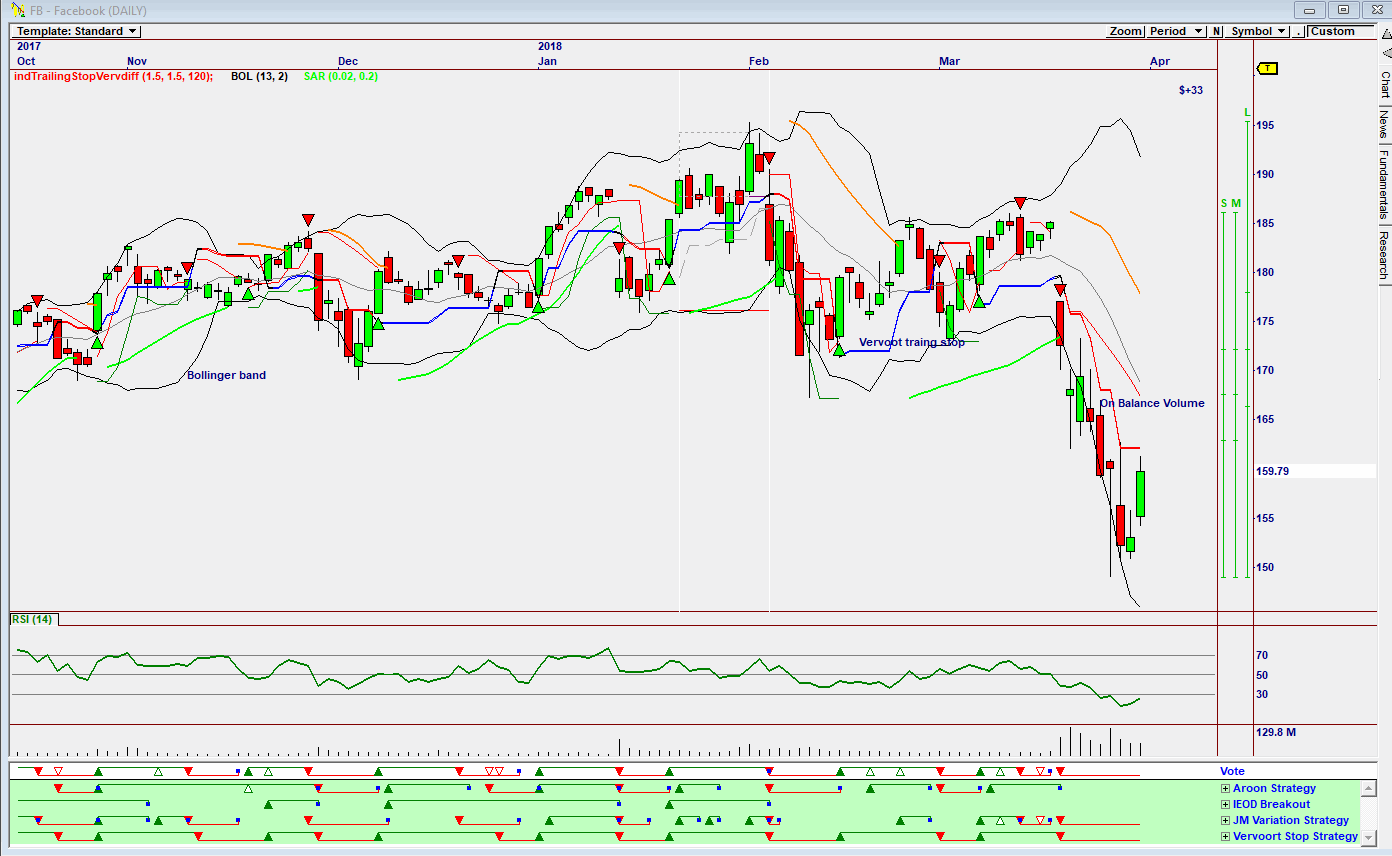
| Figure 3. Daily Omnitrader Chart. |
| Graphic provided by: Omnitrader. |
| |
| The chart in Figure 3 is an Omnitrader chart where the Vote line is still suggesting a sell. The Vote line is the result of the JM Variation strategy and the Vervoort Stop Strategy shown in green below the Vote line. Do note that the On Balance Volume indicator is still negative. Looking at the charts, one can see that a buy signal is around the corner. Those who are prepared to take the risk, could start buying half of what they would like to own, waiting for a definite buy signal. Conservative investors could wait for an Omnitrader buy. |
Has been a technical analyst since 1969, and has worked as a futures and options trader with First Financial Futures in Johannesburg, South Africa.
| Address: | 3256 West 24th Ave |
| Vancouver, BC | |
| Phone # for sales: | 6042634214 |
| E-mail address: | petroosp@gmail.com |
Click here for more information about our publications!
PRINT THIS ARTICLE

Request Information From Our Sponsors
- StockCharts.com, Inc.
- Candle Patterns
- Candlestick Charting Explained
- Intermarket Technical Analysis
- John Murphy on Chart Analysis
- John Murphy's Chart Pattern Recognition
- John Murphy's Market Message
- MurphyExplainsMarketAnalysis-Intermarket Analysis
- MurphyExplainsMarketAnalysis-Visual Analysis
- StockCharts.com
- Technical Analysis of the Financial Markets
- The Visual Investor
- VectorVest, Inc.
- Executive Premier Workshop
- One-Day Options Course
- OptionsPro
- Retirement Income Workshop
- Sure-Fire Trading Systems (VectorVest, Inc.)
- Trading as a Business Workshop
- VectorVest 7 EOD
- VectorVest 7 RealTime/IntraDay
- VectorVest AutoTester
- VectorVest Educational Services
- VectorVest OnLine
- VectorVest Options Analyzer
- VectorVest ProGraphics v6.0
- VectorVest ProTrader 7
- VectorVest RealTime Derby Tool
- VectorVest Simulator
- VectorVest Variator
- VectorVest Watchdog
