

HOT TOPICS LIST
- MACD
- Fibonacci
- RSI
- Gann
- ADXR
- Stochastics
- Volume
- Triangles
- Futures
- Cycles
- Volatility
- ZIGZAG
- MESA
- Retracement
- Aroon
INDICATORS LIST
LIST OF TOPICS
PRINT THIS ARTICLE
by Stella Osoba, CMT
AbbVie's (ABBV) stock got slammed after disappointing results on small cell lung cancer drug, Rova-T, test results. The drug was the lead product of Stemcentrix, the biotech company ABBV acquired back in 2016 for $5.8 billion. On Thursday, March 22, 2018, ABBV'S stock gapped down and lost 12.8% of its value in heavy trading. The gap down resulted in a band of resistance which is the subject of this article.
Position: N/A
Stella Osoba, CMT
Stella Osoba is a trader and financial writer. She is a frequent contributor to "Technical Analysis of Stocks and Commodities" magazine and "Traders.com Advantage" as well as other financial publications.
PRINT THIS ARTICLE
TECHNICAL ANALYSIS
ABBV'S Band of Resistance
04/19/18 03:50:01 PMby Stella Osoba, CMT
AbbVie's (ABBV) stock got slammed after disappointing results on small cell lung cancer drug, Rova-T, test results. The drug was the lead product of Stemcentrix, the biotech company ABBV acquired back in 2016 for $5.8 billion. On Thursday, March 22, 2018, ABBV'S stock gapped down and lost 12.8% of its value in heavy trading. The gap down resulted in a band of resistance which is the subject of this article.
Position: N/A
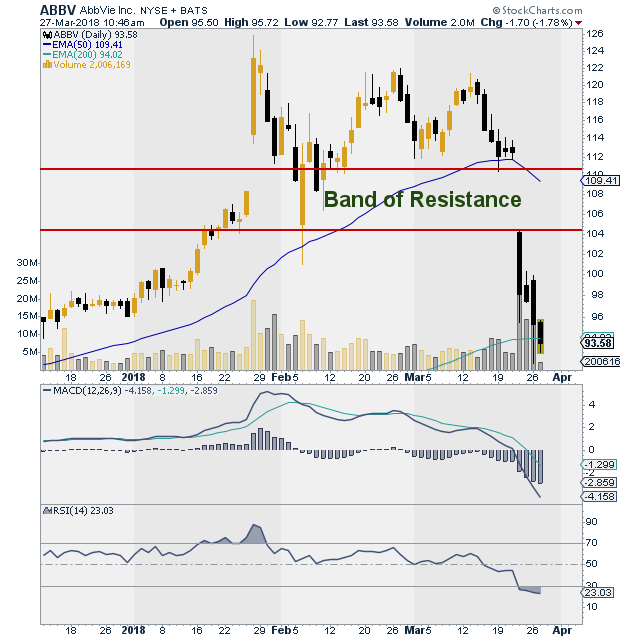
| After an impressive uptrend through 2017, culminating in a gap up and new high of 25.86 on January 26, 2018, ABBV trended sideways until March 21, 2018, finding support at its 50-day moving average. Though news of Rova-T test results came out after market close on Wednesday, the chart showed that the technicals were already weakening with price making a series of lower highs in February and March 2018. The sideways move was evidence of indecision as the bulls and bears battled, with neither side able to assert itself and gain dominance until March 22, 2018. |
| The announcement of the poor test results was news the market was waiting for that caused a decisive move in the stock, ending the stalemate. Selling pressure accelerated the price decline and with the resulting falling window or gap, it was clear that the battle had been won by the bears. Gaps or windows as they are called in candlesticks are continuation signals. The Japanese say, "go in the direction of the window." The selling pressure meant the bears were now in control. Bulls had retreated for the time being. |
|
| Figure 1. Daily chart for ABBV. |
| Graphic provided by: StockCharts.com. |
| |
| There is another Japanese saying that goes, "Corrections stop at the window." This means that the entire price vacuum created by the falling window now becomes resistance. (See chart in Figure 1). If price rallies to the top of the resistance band, but does not close above it, resistance stays intact. So in this case we should be looking for price to close above 110.72 for the resistance created by the falling window to be negated. Until this happens, the better trade might be to short at the bulges. |
Stella Osoba is a trader and financial writer. She is a frequent contributor to "Technical Analysis of Stocks and Commodities" magazine and "Traders.com Advantage" as well as other financial publications.
| E-mail address: | stellaosoba@gmail.com |
Click here for more information about our publications!
PRINT THIS ARTICLE

Request Information From Our Sponsors
- StockCharts.com, Inc.
- Candle Patterns
- Candlestick Charting Explained
- Intermarket Technical Analysis
- John Murphy on Chart Analysis
- John Murphy's Chart Pattern Recognition
- John Murphy's Market Message
- MurphyExplainsMarketAnalysis-Intermarket Analysis
- MurphyExplainsMarketAnalysis-Visual Analysis
- StockCharts.com
- Technical Analysis of the Financial Markets
- The Visual Investor
- VectorVest, Inc.
- Executive Premier Workshop
- One-Day Options Course
- OptionsPro
- Retirement Income Workshop
- Sure-Fire Trading Systems (VectorVest, Inc.)
- Trading as a Business Workshop
- VectorVest 7 EOD
- VectorVest 7 RealTime/IntraDay
- VectorVest AutoTester
- VectorVest Educational Services
- VectorVest OnLine
- VectorVest Options Analyzer
- VectorVest ProGraphics v6.0
- VectorVest ProTrader 7
- VectorVest RealTime Derby Tool
- VectorVest Simulator
- VectorVest Variator
- VectorVest Watchdog