

HOT TOPICS LIST
- MACD
- Fibonacci
- RSI
- Gann
- ADXR
- Stochastics
- Volume
- Triangles
- Futures
- Cycles
- Volatility
- ZIGZAG
- MESA
- Retracement
- Aroon
INDICATORS LIST
LIST OF TOPICS
PRINT THIS ARTICLE
by Koos van der Merwe
The correction looks as though it is here. If it is, then where is the bottom?
Position: Sell
Koos van der Merwe
Has been a technical analyst since 1969, and has worked as a futures and options trader with First Financial Futures in Johannesburg, South Africa.
PRINT THIS ARTICLE
ELLIOTT WAVE
So, Where And When Is The Bottom?
04/06/18 11:03:40 AMby Koos van der Merwe
The correction looks as though it is here. If it is, then where is the bottom?
Position: Sell
| Late March was a time where the stock market corrected strongly because of the potential trade war with China. The Dow Jones Industrial Average dropped more than 700 points on Thursday, March 22 and by more than 400 points on Friday, March 23. The question now on everyone's mind is, "when is the bottom? When can we start buying again?" To determine this date, as close as we can, one must first determine how low can the indexes fall? Elliott wave analysis does suggest a target. "A Wave 5 correction occurs somewhere in the previous wave 4." This was the rule, but with machines increasingly placing trades at lighting-fast speeds, Elliott waves, as originally suggested by Ralph N. Elliott, are becoming less accurate. |
|
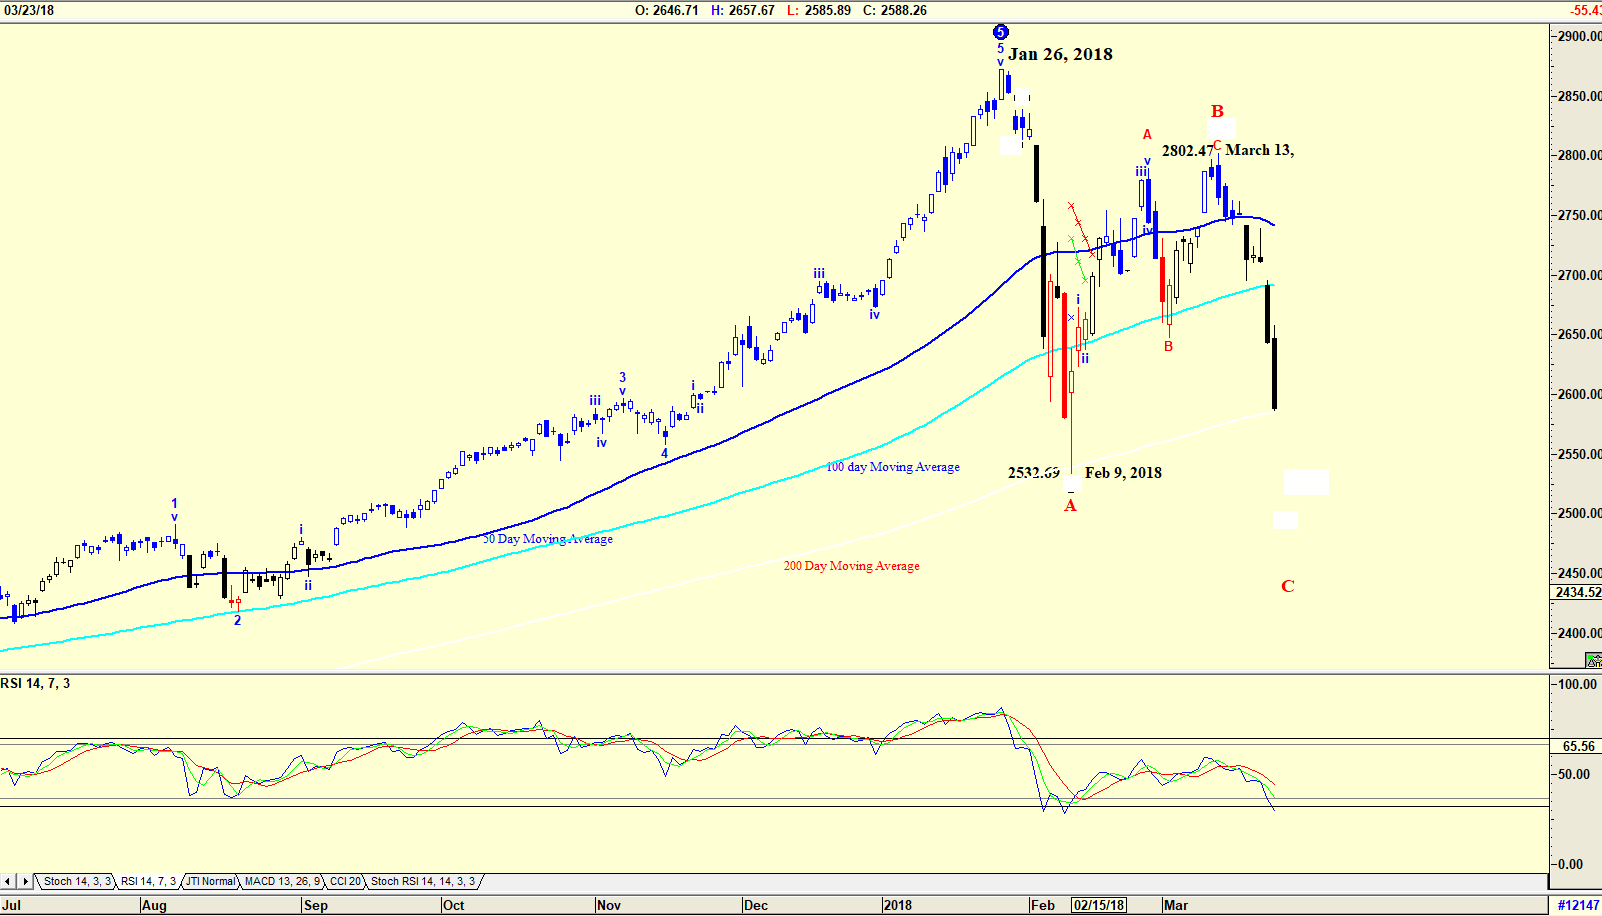
| Figure 1. Daily chart of the S&P500 Index. |
| Graphic provided by: AdvancedGET. |
| |
| The chart in Figure 1 is a daily chart of the S&P500 Index. The chart shows that a WAVE 5 top was reached on January 26, 2018. The Index then fell in a WAVE A to test the 200-day moving average at 2532.69 before rising in a WAVE B to 2802.47. The index then fell to test the 200-day moving average. Will this be a support similar to that of WAVE A? Elliott wave analysis suggests that the Index should fall further, as shown in the chart of Figure 2. |
|
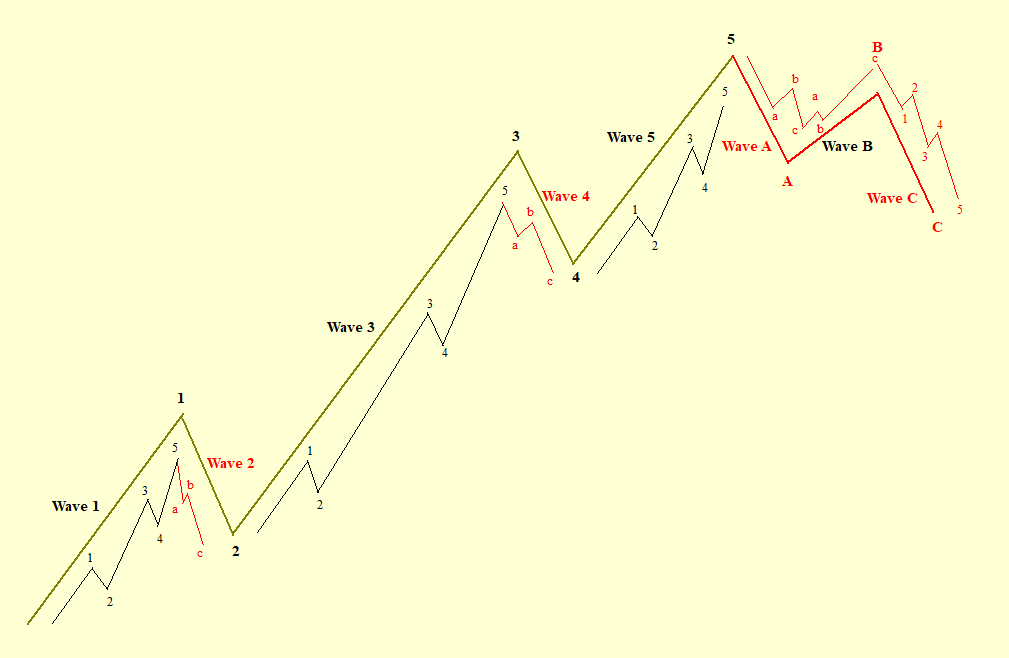
| Figure 2. Chart of Elliott wave count., |
| Graphic provided by: AdvancedGET. |
| |
| The chart in Figure 2 is a chart of what the Elliott wave should look like. However, with machines that place trades becoming more and more active, whether an Index will follow the pattern is debatable. Nevertheless, to determine how far an index could fall, one should use the pattern as a guide. The pattern shows that the WAVE C should fall in 5 waves, bottoming somewhere in the 4th WAVE of lesser degree. The S&P 500 Index could find support on the 200-day moving average, but that could be the low of wave 1 of WAVE C, then rising in a wave 2 of WAVE C before falling in wave 3 of WAVE C below the 200-day moving average. |
|
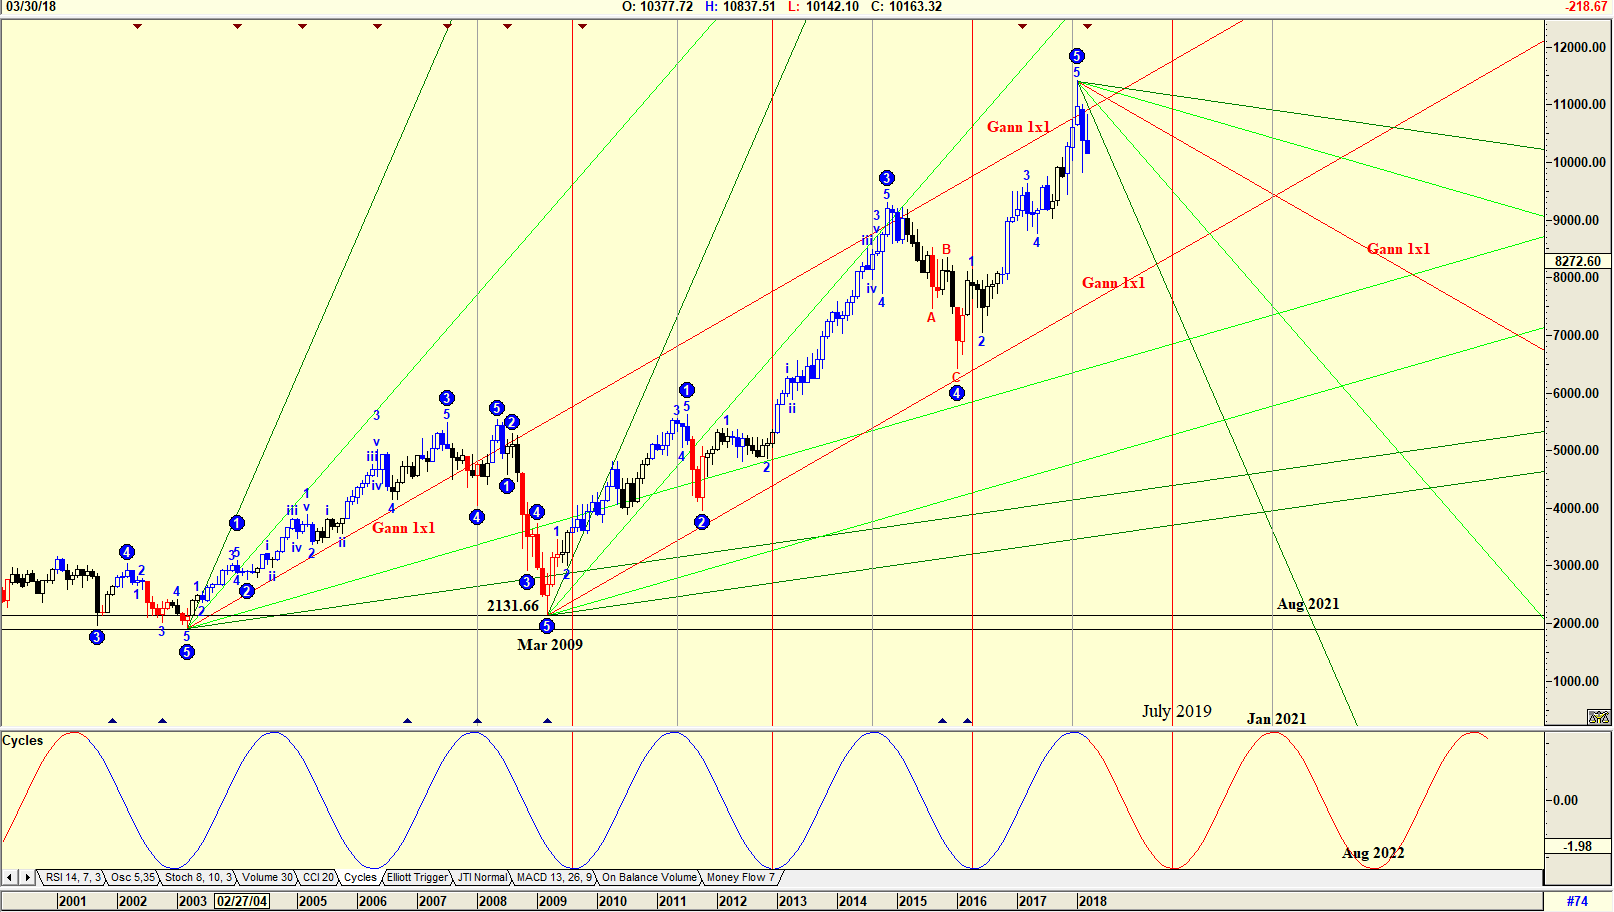
| Figure 3. Monthly chart of the Dow Transportation Index. |
| Graphic provided by: AdvancedGET. |
| |
| The chart in Figure 3 is a monthly chart of the Dow Transportation Index. The chart shows an Elliott wave reaching a WAVE 5 top on a GANN 1x1 line. Do note how the Wave 4 of the index found support on the Gann 1x1 drawn from the low of 2131.66 on March 2009. The chart also shows cycles as suggested by the Advanced GET program. Note how in every instance the cycle came very close to hitting the top and bottom of the Index. The cycle is suggesting a bottom in July 2019 and another in August 2022 with a high in January 2021. The Gann Fan drawn from the high of WAVE 5 is suggesting a bottom on August 2021. Of course, the question is, "which date will be the turning point?" All four dates should be noted, with July 2019, give or take a few months, the most likely. When will the Indexes bottom? The earnings season is coming at the time when US stocks are getting a beating. A trade war lurks just around the corner. If the Elliott Wave count is correct; If the cycle count is correct, then we know that the market has moved into a BEAR trend. Time will tell when the bottom will be hit, but with the heightening of trade tensions, panic selling could occur. Caution prevails. |
Has been a technical analyst since 1969, and has worked as a futures and options trader with First Financial Futures in Johannesburg, South Africa.
| Address: | 3256 West 24th Ave |
| Vancouver, BC | |
| Phone # for sales: | 6042634214 |
| E-mail address: | petroosp@gmail.com |
Click here for more information about our publications!
PRINT THIS ARTICLE

Request Information From Our Sponsors
- StockCharts.com, Inc.
- Candle Patterns
- Candlestick Charting Explained
- Intermarket Technical Analysis
- John Murphy on Chart Analysis
- John Murphy's Chart Pattern Recognition
- John Murphy's Market Message
- MurphyExplainsMarketAnalysis-Intermarket Analysis
- MurphyExplainsMarketAnalysis-Visual Analysis
- StockCharts.com
- Technical Analysis of the Financial Markets
- The Visual Investor
- VectorVest, Inc.
- Executive Premier Workshop
- One-Day Options Course
- OptionsPro
- Retirement Income Workshop
- Sure-Fire Trading Systems (VectorVest, Inc.)
- Trading as a Business Workshop
- VectorVest 7 EOD
- VectorVest 7 RealTime/IntraDay
- VectorVest AutoTester
- VectorVest Educational Services
- VectorVest OnLine
- VectorVest Options Analyzer
- VectorVest ProGraphics v6.0
- VectorVest ProTrader 7
- VectorVest RealTime Derby Tool
- VectorVest Simulator
- VectorVest Variator
- VectorVest Watchdog