HOT TOPICS LIST
- MACD
- Fibonacci
- RSI
- Gann
- ADXR
- Stochastics
- Volume
- Triangles
- Futures
- Cycles
- Volatility
- ZIGZAG
- MESA
- Retracement
- Aroon
INDICATORS LIST
LIST OF TOPICS
PRINT THIS ARTICLE
by Koos van der Merwe
The past month has seen two more members of the Presidential cabinet replaced. How does this affect the stock market?
Position: Sell
Koos van der Merwe
Has been a technical analyst since 1969, and has worked as a futures and options trader with First Financial Futures in Johannesburg, South Africa.
PRINT THIS ARTICLE
TECHNICAL ANALYSIS
The Crash Trigger
04/05/18 03:48:10 PMby Koos van der Merwe
The past month has seen two more members of the Presidential cabinet replaced. How does this affect the stock market?
Position: Sell
| Rex Tillerson, Secretary of State and Gary Cohen, the Director of the National Economic Council are no longer part of the Trump administration. Rex Tillerson was fired, and Gary Cohn resigned. The Trump administration has been rocked by high profile departures since Donald Trump took office in January 2017. How does this affect the stock market? In the first year of the Trump Presidency, the stock market rose strongly, and it was only in January 2018 that the market started correcting strongly. Whether this correction was caused by the tax cuts or by the change in the Federal Reserve Chairmanship, where Janet Yellen was replaced, is for fundamentalists to determine. As technical analysts, we look at charts and indicators that tell us what to expect but the fundamentals do give us a headache. |

|
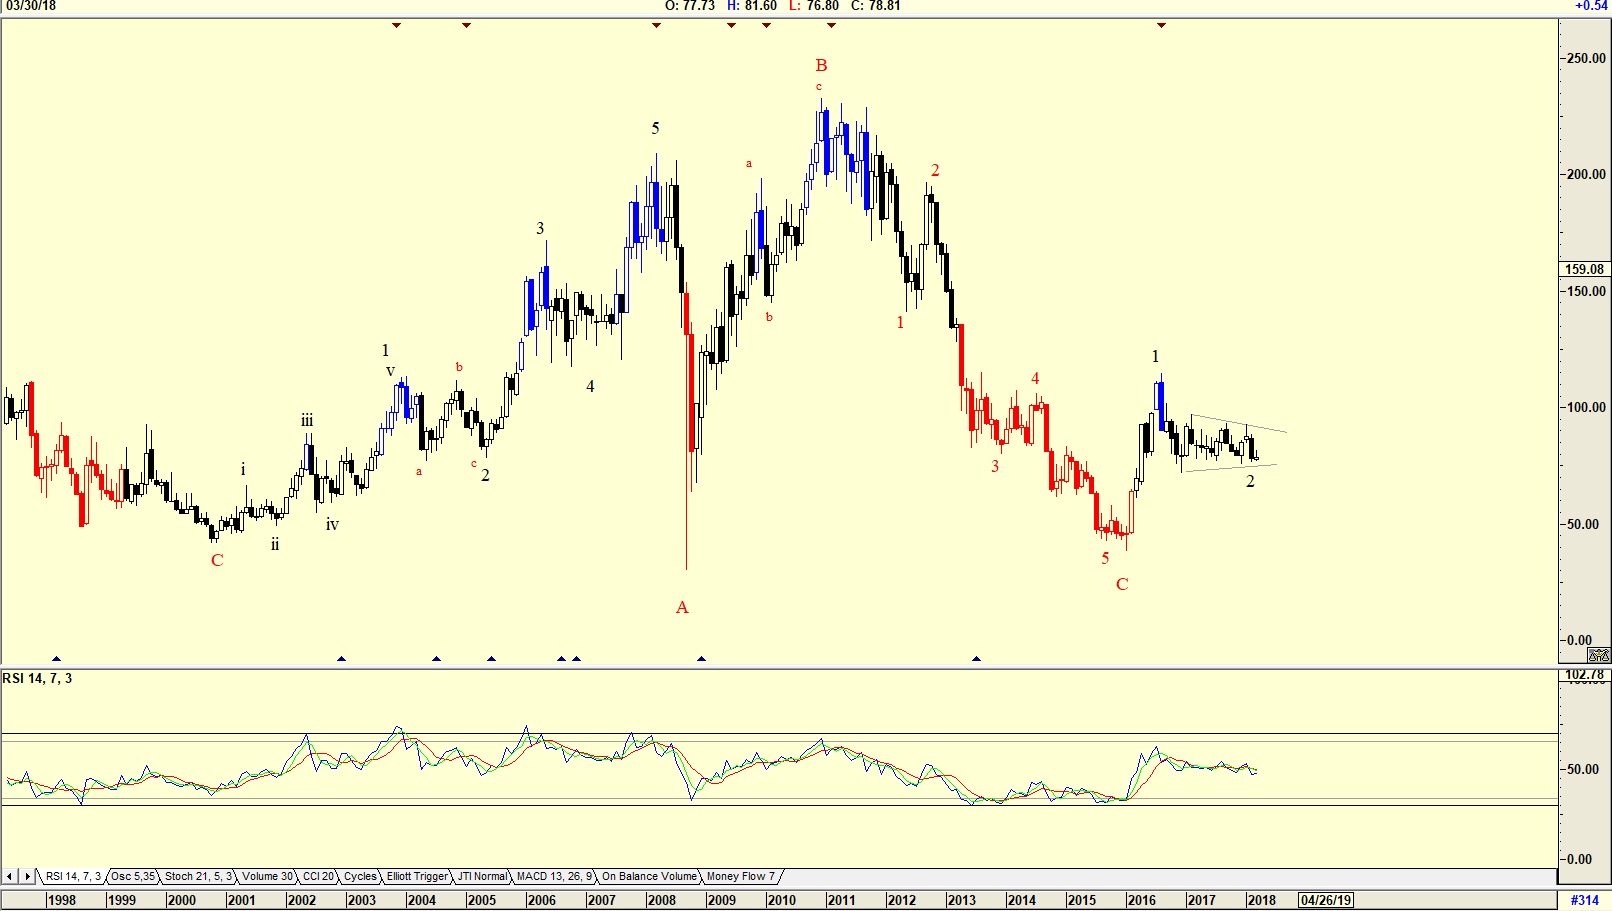
| Figure 1. The Gold and Silver Index. |
| Graphic provided by: AdvancedGET. |
| |
| The chart in Figure 1 is a monthly chart of the Gold and Silver Index which is in a WAVE 2 correction and trending sideways. This is probably because Larry Kudlow, who is replacing Gary Cohen as Donald Trump's next top economic advisor, has often said when taking part on CNBC Squawk Alley TV show that he would like to see a strong US$ and a weak Gold price. A change in who runs the show causes a change in the market; the question is for how long they will they be able to rule the roost before President Trump brings down the gavel and tweets, "You're fired." |

|
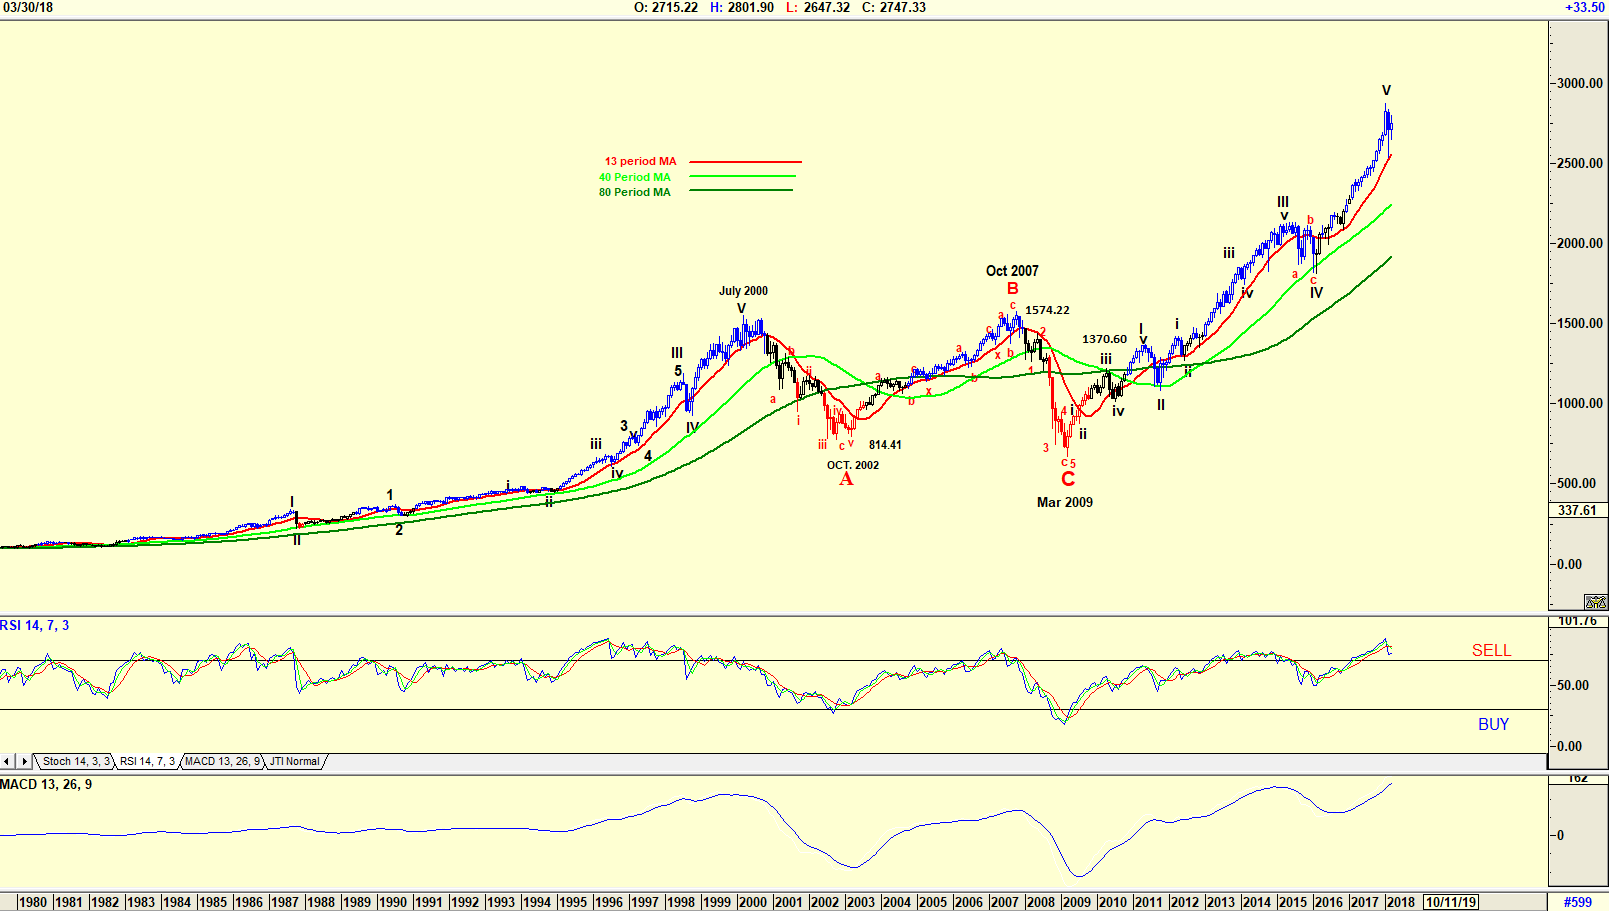
| Figure 2. The S&P500 Index. |
| Graphic provided by: AdvancedGET. |
| |
| The chart in Figure 2 is a Monthly chart of the S&P500 Index, where an Elliott wave count suggests that the index has completed a WAVE V and should now fall in an ABC correction. Whether this correction will be as long term as the ABC correction from July 2000 to March 2009 is anyone's guess. Do note that neither the RSI, which is at overbought levels, or the MACD indicators have given a sell signal yet, but they could occur soon. There is no doubt that charts of the various Indexes are calling for the start of a major correction. Larry Kudlow, a Reaganite TV economist who blew the financial crises, along with almost every other call he ever made, has become the president's top economic adviser. The crash trigger could now be in place. |
Has been a technical analyst since 1969, and has worked as a futures and options trader with First Financial Futures in Johannesburg, South Africa.
| Address: | 3256 West 24th Ave |
| Vancouver, BC | |
| Phone # for sales: | 6042634214 |
| E-mail address: | petroosp@gmail.com |
Click here for more information about our publications!
PRINT THIS ARTICLE

Request Information From Our Sponsors
- StockCharts.com, Inc.
- Candle Patterns
- Candlestick Charting Explained
- Intermarket Technical Analysis
- John Murphy on Chart Analysis
- John Murphy's Chart Pattern Recognition
- John Murphy's Market Message
- MurphyExplainsMarketAnalysis-Intermarket Analysis
- MurphyExplainsMarketAnalysis-Visual Analysis
- StockCharts.com
- Technical Analysis of the Financial Markets
- The Visual Investor
- VectorVest, Inc.
- Executive Premier Workshop
- One-Day Options Course
- OptionsPro
- Retirement Income Workshop
- Sure-Fire Trading Systems (VectorVest, Inc.)
- Trading as a Business Workshop
- VectorVest 7 EOD
- VectorVest 7 RealTime/IntraDay
- VectorVest AutoTester
- VectorVest Educational Services
- VectorVest OnLine
- VectorVest Options Analyzer
- VectorVest ProGraphics v6.0
- VectorVest ProTrader 7
- VectorVest RealTime Derby Tool
- VectorVest Simulator
- VectorVest Variator
- VectorVest Watchdog
