HOT TOPICS LIST
- MACD
- Fibonacci
- RSI
- Gann
- ADXR
- Stochastics
- Volume
- Triangles
- Futures
- Cycles
- Volatility
- ZIGZAG
- MESA
- Retracement
- Aroon
INDICATORS LIST
LIST OF TOPICS
PRINT THIS ARTICLE
by Stella Osoba, CMT
Since its close at 206.05 on January 26, 2018, Home Depot (HD) has been in a rout. What do the technicals say about this Dow darling?
Position: Hold
Stella Osoba, CMT
Stella Osoba is a trader and financial writer. She is a frequent contributor to "Technical Analysis of Stocks and Commodities" magazine and "Traders.com Advantage" as well as other financial publications.
PRINT THIS ARTICLE
DESCENDING TRIANGLES
Home Depot
03/23/18 11:51:20 AMby Stella Osoba, CMT
Since its close at 206.05 on January 26, 2018, Home Depot (HD) has been in a rout. What do the technicals say about this Dow darling?
Position: Hold
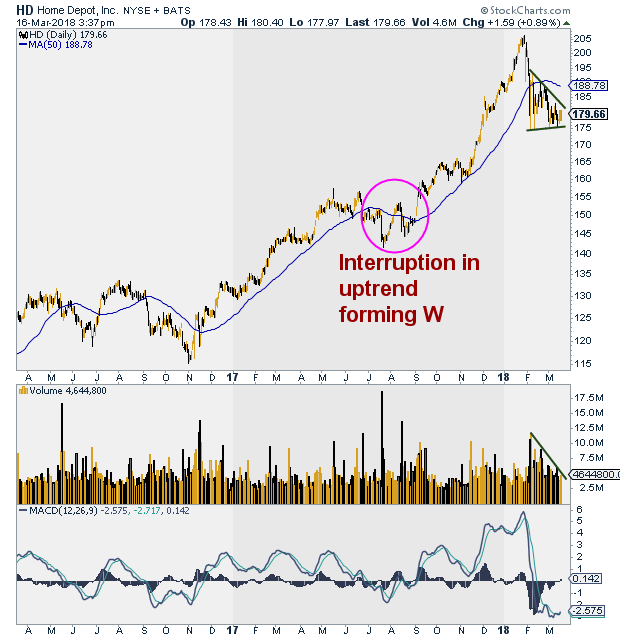
| HD's current uptrend started in November 2016. Its low was around 115 falling below its prior most recent low. But after that, the stock came to life, quickly accelerating up past its breakout point of 133. It went steadily higher, month after month, and apart from a hiccup between June and September of 2017, it seemed it could do no wrong technically. In fact, the hiccup resolved itself in a bullish W pattern and the uptrend quickly gathered steam, rising above 200 in January 2018. |
| But the speedy pullback which saw the DOW losing 1000 points in one day in February, hit HD just as hard. A glance at its chart will see that the pullback took the stock down to a low of 174 in February 2018. With the stock now trading at 179 over a month later, HD has not seen much in the way of price appreciation since its breakdown. The question now is, what is next for this stock? Was the February rout merely a hiccup which HD will recover from and soon leave in the past, or did the breakdown do significant technical damage and is there more pain to come for this stock in the near future? |

|
| Figure 1. Daily chart for Home Depot. |
| Graphic provided by: StockCharts.com. |
| |
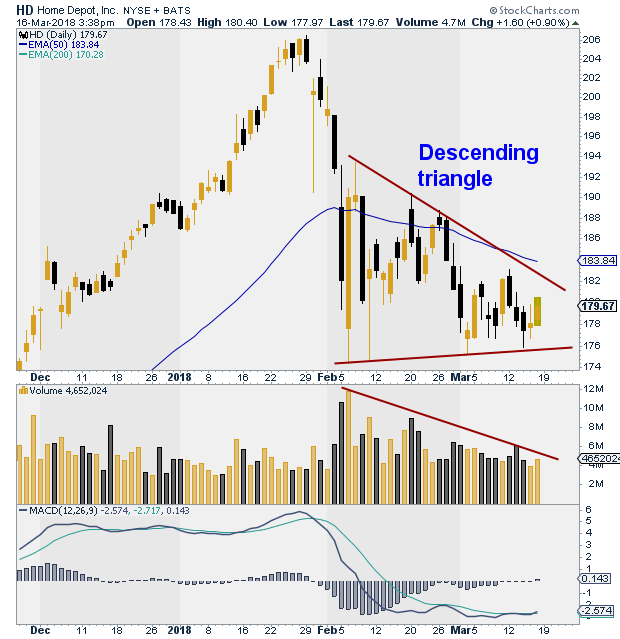
| The technicals do not give us much to celebrate yet. Currently, HD has formed a descending triangle. A descending triangle is a bearish continuation pattern. This means that there is a probability that the stock will break down from its lower horizontal line to mark new lows in the future. If the break is to the downside, the downside price target is the height of the triangle. |

|
| Figure 2. Descending triangle on HD chart. |
| Graphic provided by: StockCharts.com. |
| |
| As a descending triangle forms, volume normally contracts which we can see happening in this case. Once price breaks out, we can expect volume to expand to confirm the pattern, but as this is likely to be a downside break, expanding volume is not always necessary. |
| With all technical signals, it is important to wait for confirmation before acting on them. In this case confirmation would be a definite downside break down through the lower horizontal line of the descending triangle price pattern. If on the other hand, the break is to the upside, above the descending trend-line, then the pattern has failed. A failed pattern would mean that the next likely move for HD would be to the upside, which would be good news for the stock. |
Stella Osoba is a trader and financial writer. She is a frequent contributor to "Technical Analysis of Stocks and Commodities" magazine and "Traders.com Advantage" as well as other financial publications.
| E-mail address: | stellaosoba@gmail.com |
Click here for more information about our publications!
Comments

Request Information From Our Sponsors
- StockCharts.com, Inc.
- Candle Patterns
- Candlestick Charting Explained
- Intermarket Technical Analysis
- John Murphy on Chart Analysis
- John Murphy's Chart Pattern Recognition
- John Murphy's Market Message
- MurphyExplainsMarketAnalysis-Intermarket Analysis
- MurphyExplainsMarketAnalysis-Visual Analysis
- StockCharts.com
- Technical Analysis of the Financial Markets
- The Visual Investor
- VectorVest, Inc.
- Executive Premier Workshop
- One-Day Options Course
- OptionsPro
- Retirement Income Workshop
- Sure-Fire Trading Systems (VectorVest, Inc.)
- Trading as a Business Workshop
- VectorVest 7 EOD
- VectorVest 7 RealTime/IntraDay
- VectorVest AutoTester
- VectorVest Educational Services
- VectorVest OnLine
- VectorVest Options Analyzer
- VectorVest ProGraphics v6.0
- VectorVest ProTrader 7
- VectorVest RealTime Derby Tool
- VectorVest Simulator
- VectorVest Variator
- VectorVest Watchdog
