HOT TOPICS LIST
- MACD
- Fibonacci
- RSI
- Gann
- ADXR
- Stochastics
- Volume
- Triangles
- Futures
- Cycles
- Volatility
- ZIGZAG
- MESA
- Retracement
- Aroon
INDICATORS LIST
LIST OF TOPICS
PRINT THIS ARTICLE
by Koos van der Merwe
In my article "Analyzing Bombadier," (November 14, 2002), I concluded that the chart was forming a cup and handle pattern, with a breakout handle at 6.04. How did the UAL Corp's (United Airlines) bankruptcy affect the share price of Bombardier?
Position: Accumulate
Koos van der Merwe
Has been a technical analyst since 1969, and has worked as a futures and options trader with First Financial Futures in Johannesburg, South Africa.
PRINT THIS ARTICLE
MOVING AVERAGES
Bombardier and UAL Corp.
12/13/02 11:42:18 AMby Koos van der Merwe
In my article "Analyzing Bombadier," (November 14, 2002), I concluded that the chart was forming a cup and handle pattern, with a breakout handle at 6.04. How did the UAL Corp's (United Airlines) bankruptcy affect the share price of Bombardier?
Position: Accumulate
| On the chart below of Bombardier (CA:BBDB), I have used the JM internal band strategy to analyze this stock's long-term potential. The company is paying a dividend that offers a yield of 3.6% which could be attractive for a certain class of investor. |
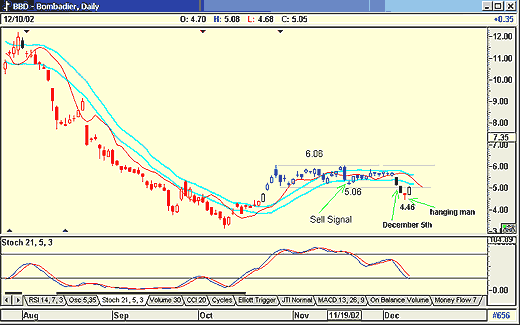
| The JM parameters are a 15-day moving average offset by 4% and -4%. The chart shows the cup and an elongated handle that slowly developed into a parallelogram. At 5.06, as shown on the chart, it broke below the lower JM band, and gave a sell signal. The price recovered but never broke above the upper band to give a buy signal, so short seller would have remained short. |

|
| Bombardier - still there? |
| Graphic provided by: AdvancedGET. |
| |
| On December 5th, United Airlines (UAL Corp.) announced that it was going into bankruptcy. The market immediately sold Bombardier shares as investors believed that the company, whose main business is to manufacture regional jet planes, would be severly affected by the bankruptcy. The share had dropped to 4.46 when a hanging man candlestick pattern formed, suggesting the price had bottomed and should start rising. |
| The share has started recovering, and recent fundamental reports state that Bombardier Inc.'s credit rating and outlook will not be affected by UAL's bankruptcy filing because jet orders have not been cancelled or deferred. |
| The possible cup and handle pattern remains in place, and a break above the upper JM band at 5.59 would be a strong suggestion that the resistance level of 6.06 could be broken, confirming the JM buy signal. Do note that my preferred stochastic (21, 5, 3) is also at oversold levels. |
Has been a technical analyst since 1969, and has worked as a futures and options trader with First Financial Futures in Johannesburg, South Africa.
| Address: | 3256 West 24th Ave |
| Vancouver, BC | |
| Phone # for sales: | 6042634214 |
| E-mail address: | petroosp@gmail.com |
Click here for more information about our publications!
Comments
Date: 12/15/02Rank: 4Comment:

Request Information From Our Sponsors
- StockCharts.com, Inc.
- Candle Patterns
- Candlestick Charting Explained
- Intermarket Technical Analysis
- John Murphy on Chart Analysis
- John Murphy's Chart Pattern Recognition
- John Murphy's Market Message
- MurphyExplainsMarketAnalysis-Intermarket Analysis
- MurphyExplainsMarketAnalysis-Visual Analysis
- StockCharts.com
- Technical Analysis of the Financial Markets
- The Visual Investor
- VectorVest, Inc.
- Executive Premier Workshop
- One-Day Options Course
- OptionsPro
- Retirement Income Workshop
- Sure-Fire Trading Systems (VectorVest, Inc.)
- Trading as a Business Workshop
- VectorVest 7 EOD
- VectorVest 7 RealTime/IntraDay
- VectorVest AutoTester
- VectorVest Educational Services
- VectorVest OnLine
- VectorVest Options Analyzer
- VectorVest ProGraphics v6.0
- VectorVest ProTrader 7
- VectorVest RealTime Derby Tool
- VectorVest Simulator
- VectorVest Variator
- VectorVest Watchdog
