

HOT TOPICS LIST
- MACD
- Fibonacci
- RSI
- Gann
- ADXR
- Stochastics
- Volume
- Triangles
- Futures
- Cycles
- Volatility
- ZIGZAG
- MESA
- Retracement
- Aroon
INDICATORS LIST
LIST OF TOPICS
PRINT THIS ARTICLE
by Koos van der Merwe
Finding which stock to buy can be a challenge.
Position: Accumulate
Koos van der Merwe
Has been a technical analyst since 1969, and has worked as a futures and options trader with First Financial Futures in Johannesburg, South Africa.
PRINT THIS ARTICLE
STRATEGIES
Stocks To Look At
03/08/18 04:27:25 PMby Koos van der Merwe
Finding which stock to buy can be a challenge.
Position: Accumulate
| Finding a program that can analyze over 2000 shares and decide which ones are the best to buy can be a challenge. There are many programs out there that advertise that they are the best to own because their results are excellent, and they probably are. The only problem is there is a price to pay, and that price is not cheap. Will that program be successful? Yes, it will, but only after you have run it over and over again until you have personally found the answer you have been looking for, an answer that suits your personal trading strategy. |
|
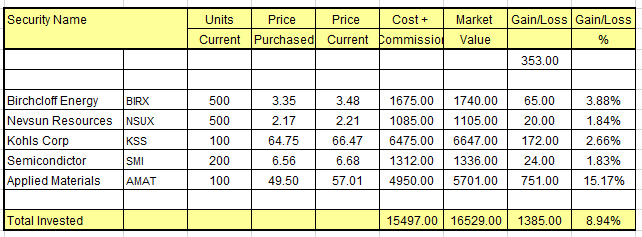
| Figure 1. A daily spreadsheet of a portfolio. |
| Graphic provided by: Excel. |
| |
| The chart in Figure 1 is an Excel spreadsheet with stocks that the program I use to analyze the stock market suggested I buy and hold. I run this analysis from the 1st of every month, to see whether the stocks suggested as buys are profitable or not. The program I use is a program I have been playing with since the 1990's and it is only over the last year, playing with Buy/Sell strategies suggested by analysts, that I have been very successful. |
|
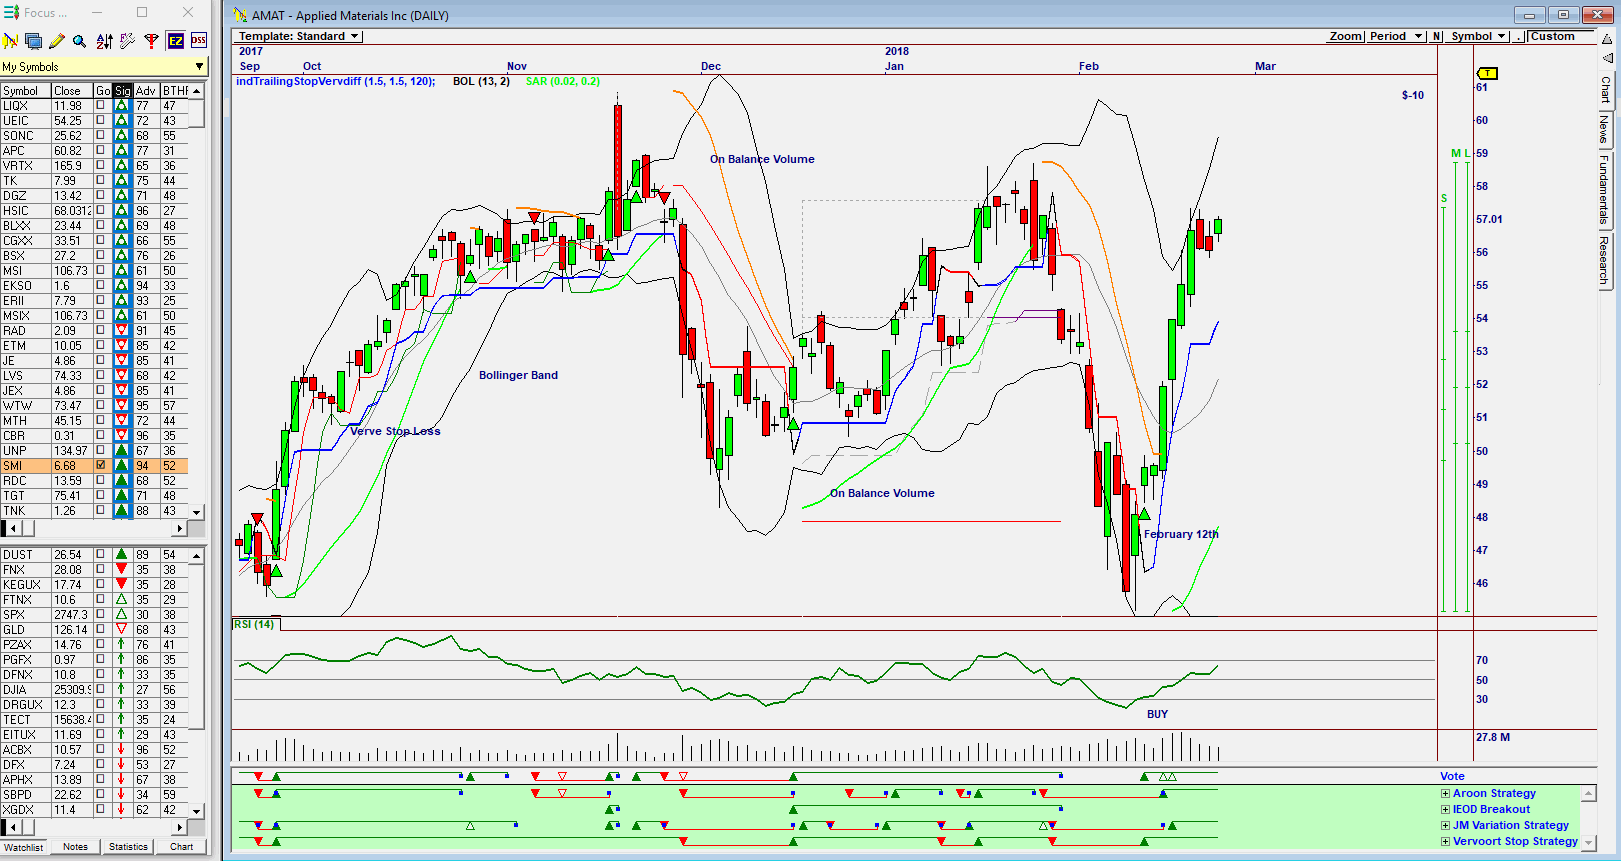
| Figure 2. Daily chart of Applied Materials. |
| Graphic provided by: Omnitrader. |
| |
| The chart in Figure 2 is a daily chart of Applied Materials Inc. Looking at the spreadsheet in Figure 1 you can see that the share has so far given me a return of 15.17%. Admittedly, some of the shares bought have given very small profits but seeing that I limit my holdings to only 5 shares each month, I could swap those that have given small profits into more profitable shares as the month proceeds by studying the charts. Looking at the list of shares on the left side of the chart, you can see which shares have suggested a new buy. The ADV and BTHR shown are the Advisor rating and Backtest Hit rate suggested by the program I use. The higher the ADV the more likely to buy the share but only if the RSI shown on the chart suggests a buy and the Vote line has given a buy. The buy/sell signal given on the Vote line are the result of the four strategies shown in green below the Vote line. These strategies have been prepared by me after studying the results of indicators suggested by various analysts. |
|
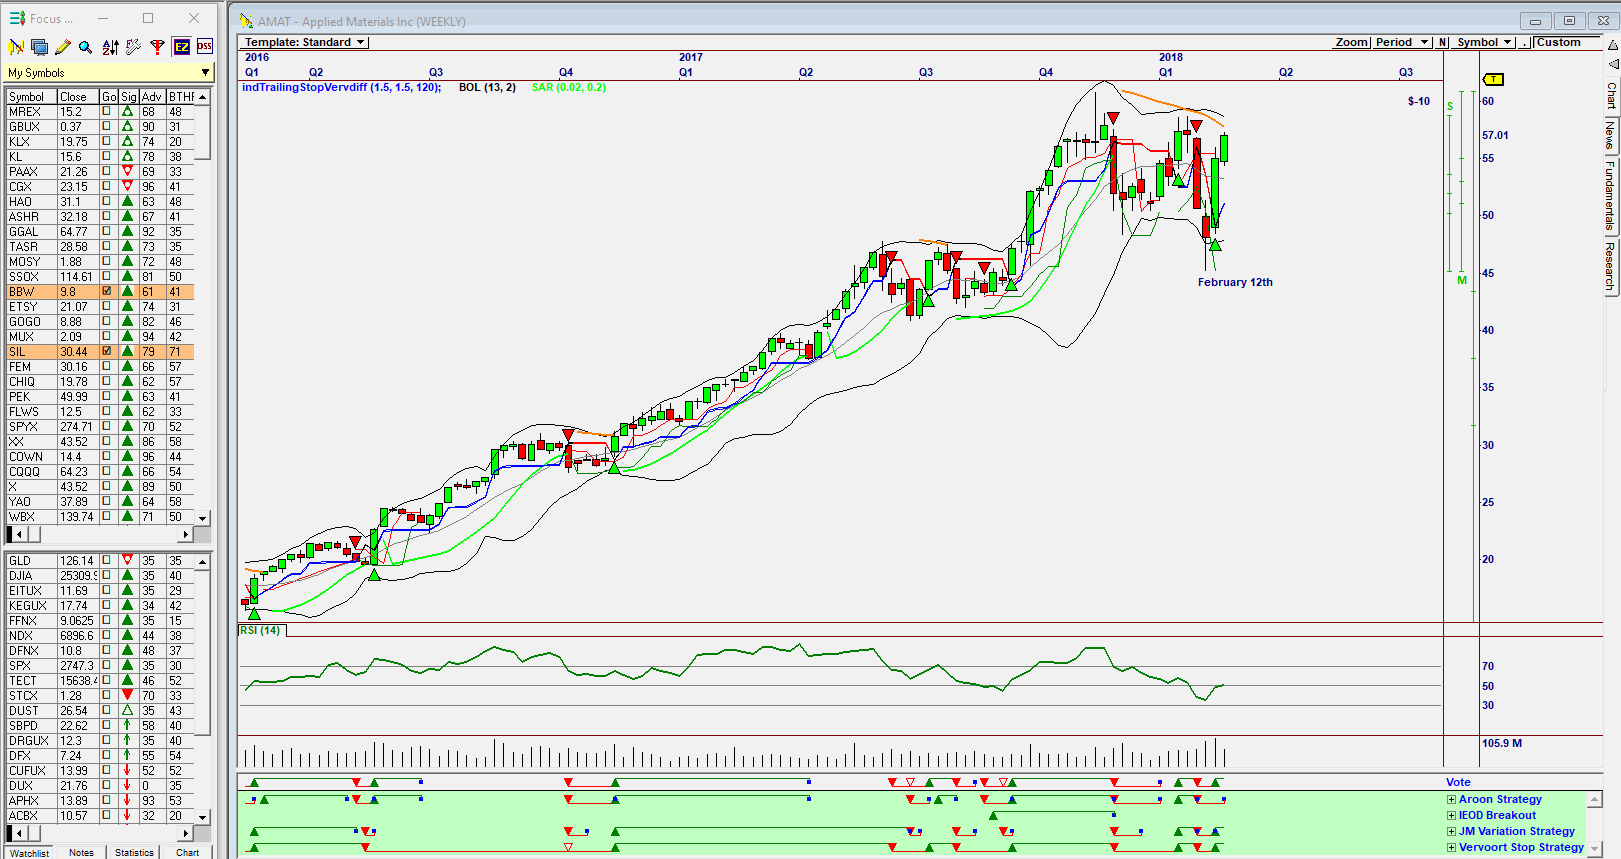
| Figure 3. Weekly chart of Applied Materials. |
| Graphic provided by: Omnitrader. |
| |
| The chart in Figure 2 is a weekly chart of Applied Materials Inc. Here, a buy signal was suggested on February 12, confirming the buy signal of the Daily chart. Note how accurate previous buy signals have been. Here, one can use the stop loss signal suggested by the chart which in some instances have been early, or a stop loss strategy used successfully by yourself over years of trading. |
|
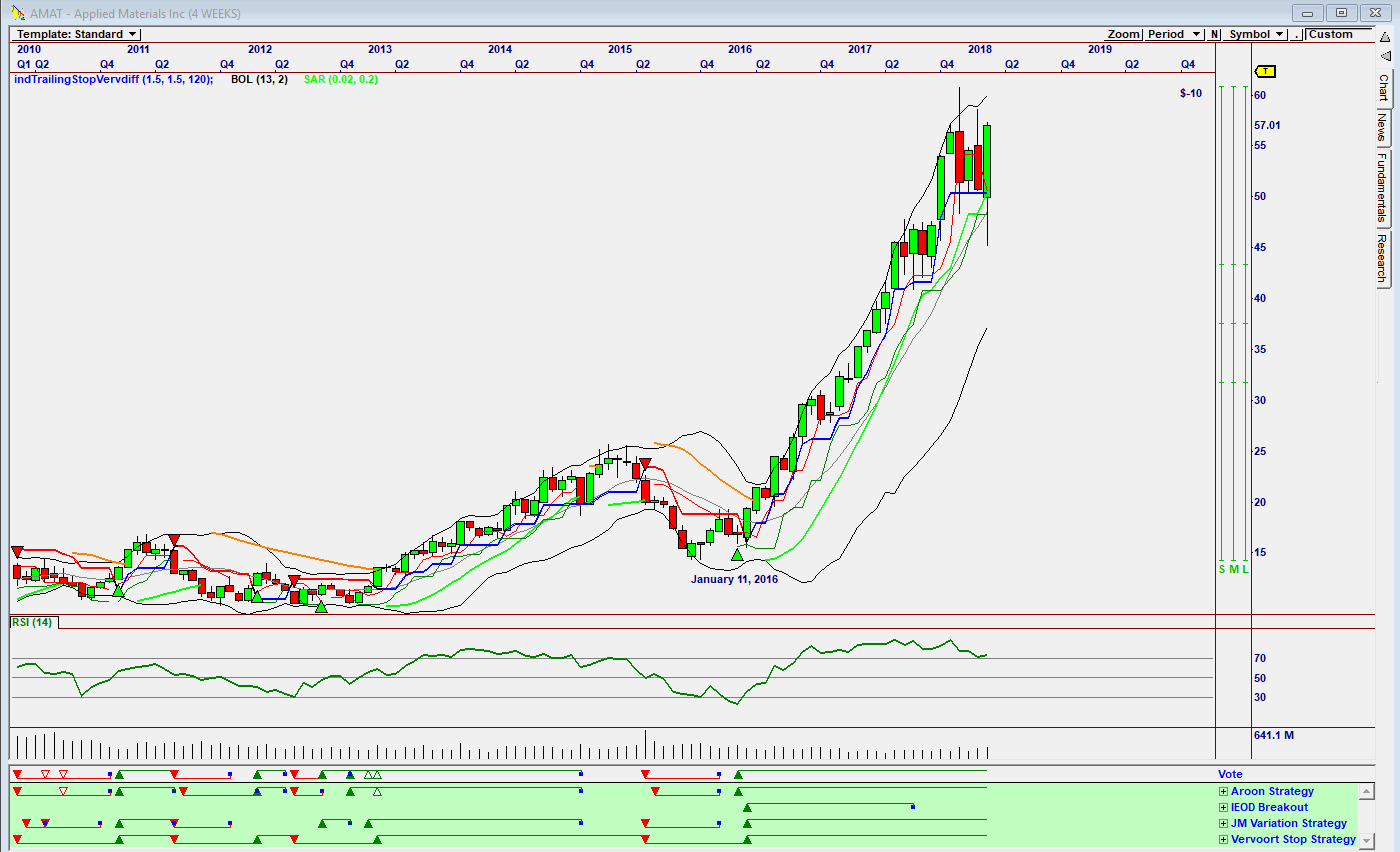
| Figure 4. Monthly chart of Applied Materials. |
| Graphic provided by: Omnitrader.. |
| |
| Finally, for those who are long-term investors and not traders, a monthly chart as suggested in Figure 4 has been very successful, having given a buy on January 11, 2016. The Vote line is still in buy mode based on the strategies of Aroon, JM Variation and Vervoort Stop strategies. Using a program that one has played with over many years to analyze the market, and whether by accident or trial and error, finding a buy/sell strategy that has been successful is not that easy, but when found, well, can only bring a happy smile to your face. |
Has been a technical analyst since 1969, and has worked as a futures and options trader with First Financial Futures in Johannesburg, South Africa.
| Address: | 3256 West 24th Ave |
| Vancouver, BC | |
| Phone # for sales: | 6042634214 |
| E-mail address: | petroosp@gmail.com |
Click here for more information about our publications!
Comments
Date:�03/09/18Rank:�1Comment:�
Date:�03/18/18Rank:�5Comment:�

Request Information From Our Sponsors
- VectorVest, Inc.
- Executive Premier Workshop
- One-Day Options Course
- OptionsPro
- Retirement Income Workshop
- Sure-Fire Trading Systems (VectorVest, Inc.)
- Trading as a Business Workshop
- VectorVest 7 EOD
- VectorVest 7 RealTime/IntraDay
- VectorVest AutoTester
- VectorVest Educational Services
- VectorVest OnLine
- VectorVest Options Analyzer
- VectorVest ProGraphics v6.0
- VectorVest ProTrader 7
- VectorVest RealTime Derby Tool
- VectorVest Simulator
- VectorVest Variator
- VectorVest Watchdog
- StockCharts.com, Inc.
- Candle Patterns
- Candlestick Charting Explained
- Intermarket Technical Analysis
- John Murphy on Chart Analysis
- John Murphy's Chart Pattern Recognition
- John Murphy's Market Message
- MurphyExplainsMarketAnalysis-Intermarket Analysis
- MurphyExplainsMarketAnalysis-Visual Analysis
- StockCharts.com
- Technical Analysis of the Financial Markets
- The Visual Investor