HOT TOPICS LIST
- MACD
- Fibonacci
- RSI
- Gann
- ADXR
- Stochastics
- Volume
- Triangles
- Futures
- Cycles
- Volatility
- ZIGZAG
- MESA
- Retracement
- Aroon
INDICATORS LIST
LIST OF TOPICS
PRINT THIS ARTICLE
by Koos van der Merwe
Elliott wave theory states that after a major WAVE V, an ABC correction occurs. A WAVE A on a daily chart usually corrects in five waves down to the low price of WAVE IV.
Position: Accumulate
Koos van der Merwe
Has been a technical analyst since 1969, and has worked as a futures and options trader with First Financial Futures in Johannesburg, South Africa.
PRINT THIS ARTICLE
ELLIOTT WAVE
Buy On The Dips
03/01/18 04:32:50 PMby Koos van der Merwe
Elliott wave theory states that after a major WAVE V, an ABC correction occurs. A WAVE A on a daily chart usually corrects in five waves down to the low price of WAVE IV.
Position: Accumulate
| We all know what the Elliott wave theory is. With the recent correction in the stock market, we can only assume that a major WAVE V has been completed and that an ABC correction is now on the cards. A Wave A correction according to the "Elliott Wave Principle" book by Frost and Prechter, suggests that a major WAVE A on a daily chart falls in five waves, bottoming at the low of the WAVE IV correction in the previous five-wave bull market. With a new Federal Reserve chairman, Jerome Powell; with the recent news that 13 Russian nationals and three Russian entities interfered in 2016 presidential election; and finally, with the tragic Florida school shooting, the stock market is facing news that could influence it negatively. |

|
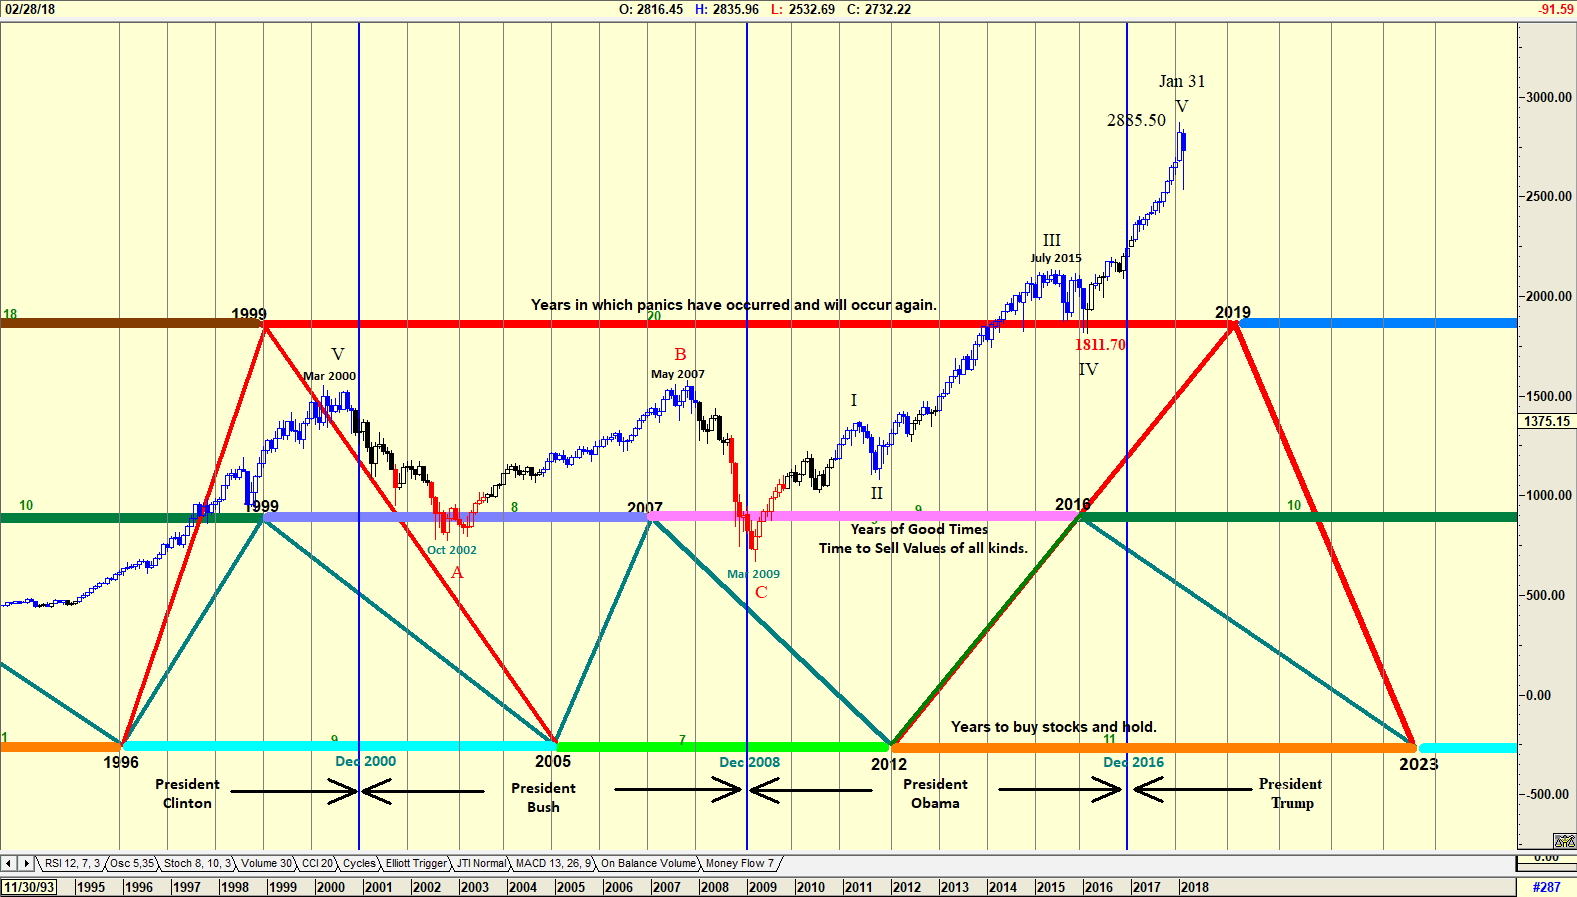
| Figure 1. Monthly chart of the S&P 500 Index and the K-Wave. |
| Graphic provided by: AdvancedGET. |
| |
| The chart in Figure 1 is a chart of the Kondratieff Wave with the S&P 500 monthly index suggesting that a WAVE V top could have happened on January 31, 2018. This suggests that an ABC correction could now occur. Looking back at the chart, we see that previously a WAVE V top occurred after the K-Wave suggested a top in 1999. For the WAVE V to top out now, one year before the suggested K-Wave 2019 correction, could be early, suggesting that the WAVE V is not complete, and could rise further. A move above 2885.50 by the index will confirm this, however, until this occurs, one should assume that a WAVE A correction is happening, a correction that could end in the year 2020. |

|
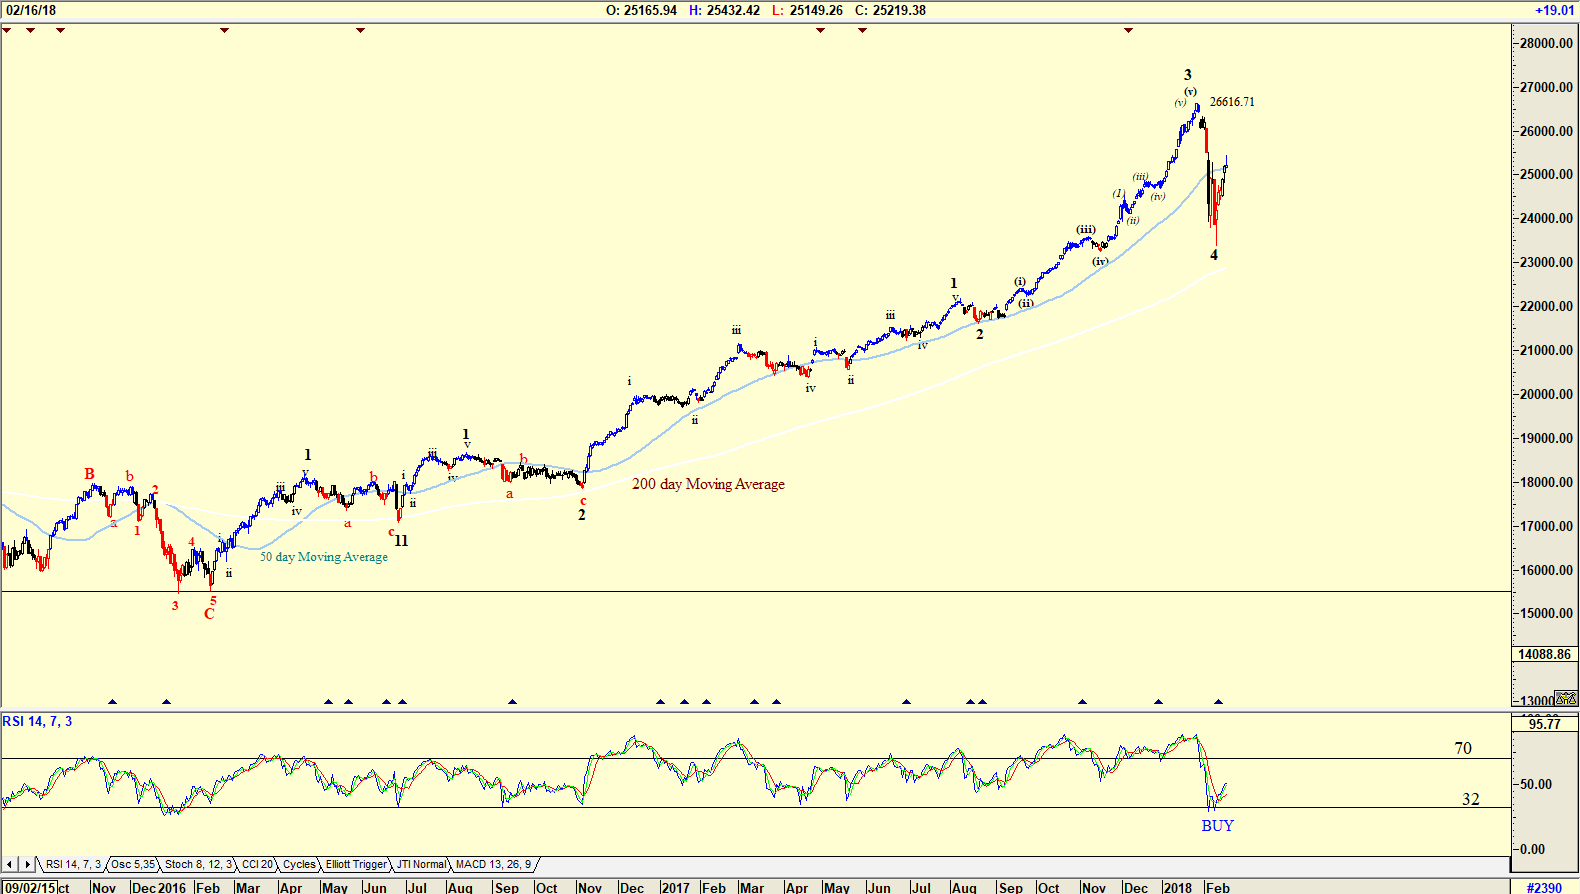
| Figure 2. Daily chart of the Dow Jones with Elliott wave count. |
| Graphic provided by: AdvancedGET. |
| |
| The chart in Figure 2 is a daily chart of the Dow Jones with an Elliott wave count suggesting that the Dow has completed a Wave 4 of a WAVE III. The RSI indicator has fallen below the 32 horizontal and has given a buy signal. This does suggest that the Dow should rise to test and break above the Wave 3 high of 26616.71. Do note that the Dow fell below the 50-day moving average and is flirting with the 200-day moving average. |

|
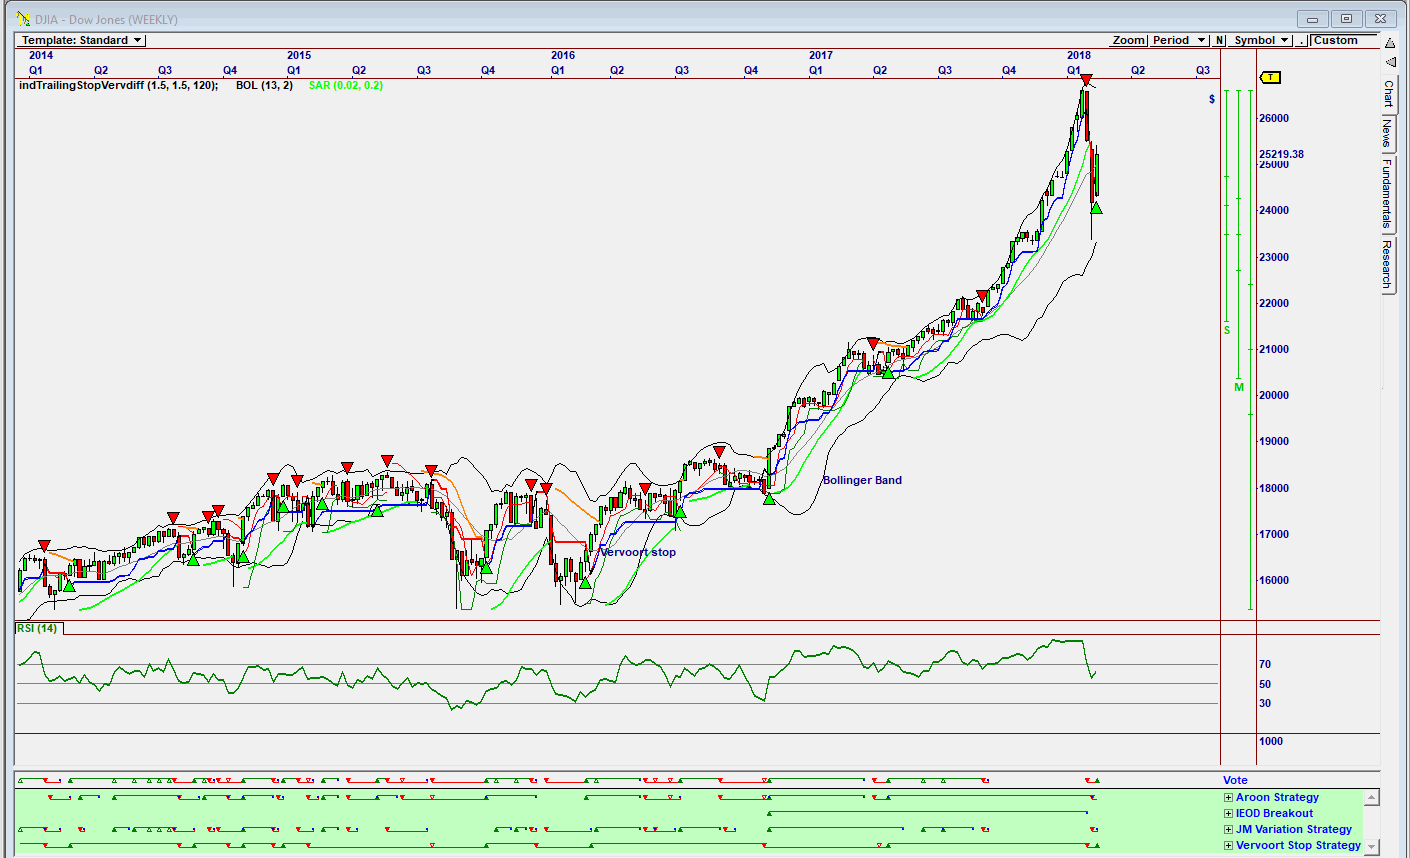
| Figure 3. Weekly Omnitrader chart of the Dow Jones. |
| Graphic provided by: Omnitrader. |
| |
| The chart in Figure 3 is a weekly Omnitrader chart of the Dow Jones Index. The Vote line on the chart is suggesting a buy signal based on a buy suggested by the Vervoort Stop Strategy shown in green below the Vote line. The Vervoort Stop strategy is a strategy developed in Omnitrader, based on the Vervoort stop equation developed by Sylvain Vervoort (check him out on Google and S&C magazine!) The RSI on the chart has not fallen below the 30 horizontal line, suggesting that further downside could occur. This is a chart to watch. With the tragedy in Florida calling for stricter gun control in the USA, with the Russian investigation hitting the news and with a new Federal Reserve Chairman, market uncertainty is first and foremost. However, one can always take a lesson put out by Warren Buffett, which is "Buy on the dips". |
Has been a technical analyst since 1969, and has worked as a futures and options trader with First Financial Futures in Johannesburg, South Africa.
| Address: | 3256 West 24th Ave |
| Vancouver, BC | |
| Phone # for sales: | 6042634214 |
| E-mail address: | petroosp@gmail.com |
Click here for more information about our publications!
PRINT THIS ARTICLE

|

Request Information From Our Sponsors
- StockCharts.com, Inc.
- Candle Patterns
- Candlestick Charting Explained
- Intermarket Technical Analysis
- John Murphy on Chart Analysis
- John Murphy's Chart Pattern Recognition
- John Murphy's Market Message
- MurphyExplainsMarketAnalysis-Intermarket Analysis
- MurphyExplainsMarketAnalysis-Visual Analysis
- StockCharts.com
- Technical Analysis of the Financial Markets
- The Visual Investor
- VectorVest, Inc.
- Executive Premier Workshop
- One-Day Options Course
- OptionsPro
- Retirement Income Workshop
- Sure-Fire Trading Systems (VectorVest, Inc.)
- Trading as a Business Workshop
- VectorVest 7 EOD
- VectorVest 7 RealTime/IntraDay
- VectorVest AutoTester
- VectorVest Educational Services
- VectorVest OnLine
- VectorVest Options Analyzer
- VectorVest ProGraphics v6.0
- VectorVest ProTrader 7
- VectorVest RealTime Derby Tool
- VectorVest Simulator
- VectorVest Variator
- VectorVest Watchdog
