HOT TOPICS LIST
- MACD
- Fibonacci
- RSI
- Gann
- ADXR
- Stochastics
- Volume
- Triangles
- Futures
- Cycles
- Volatility
- ZIGZAG
- MESA
- Retracement
- Aroon
INDICATORS LIST
LIST OF TOPICS
PRINT THIS ARTICLE
by Koos van der Merwe
The stock market is in a major correction. What now?
Position: Accumulate
Koos van der Merwe
Has been a technical analyst since 1969, and has worked as a futures and options trader with First Financial Futures in Johannesburg, South Africa.
PRINT THIS ARTICLE
TECHNICAL ANALYSIS
A Market Crash
02/15/18 03:55:47 PMby Koos van der Merwe
The stock market is in a major correction. What now?
Position: Accumulate
| The Dow Jones Industrial Average had its worst week in two years. The Index moved more than 22,000 points in one of its craziest weeks from Monday, February 5. Traders worry about the possibility of rising interest rates and volatility as measured by the VIX, which has jumped to its highest since August 2015. The market crash is reminiscent of the 1987 crash. During President Ronald Reagan's term of office, he introduced legislation to reduce taxes. At the same time, Paul Volcker, Chairman of the Federal Reserve, was being replaced by Alan Greenspan. Two months after he took office, the October 1987 market crash happened. With Janet Yellen's resignation and the appointment of Jerome Powell followed by the present market crash. So, with the present market crash, where do you put your money? |

|
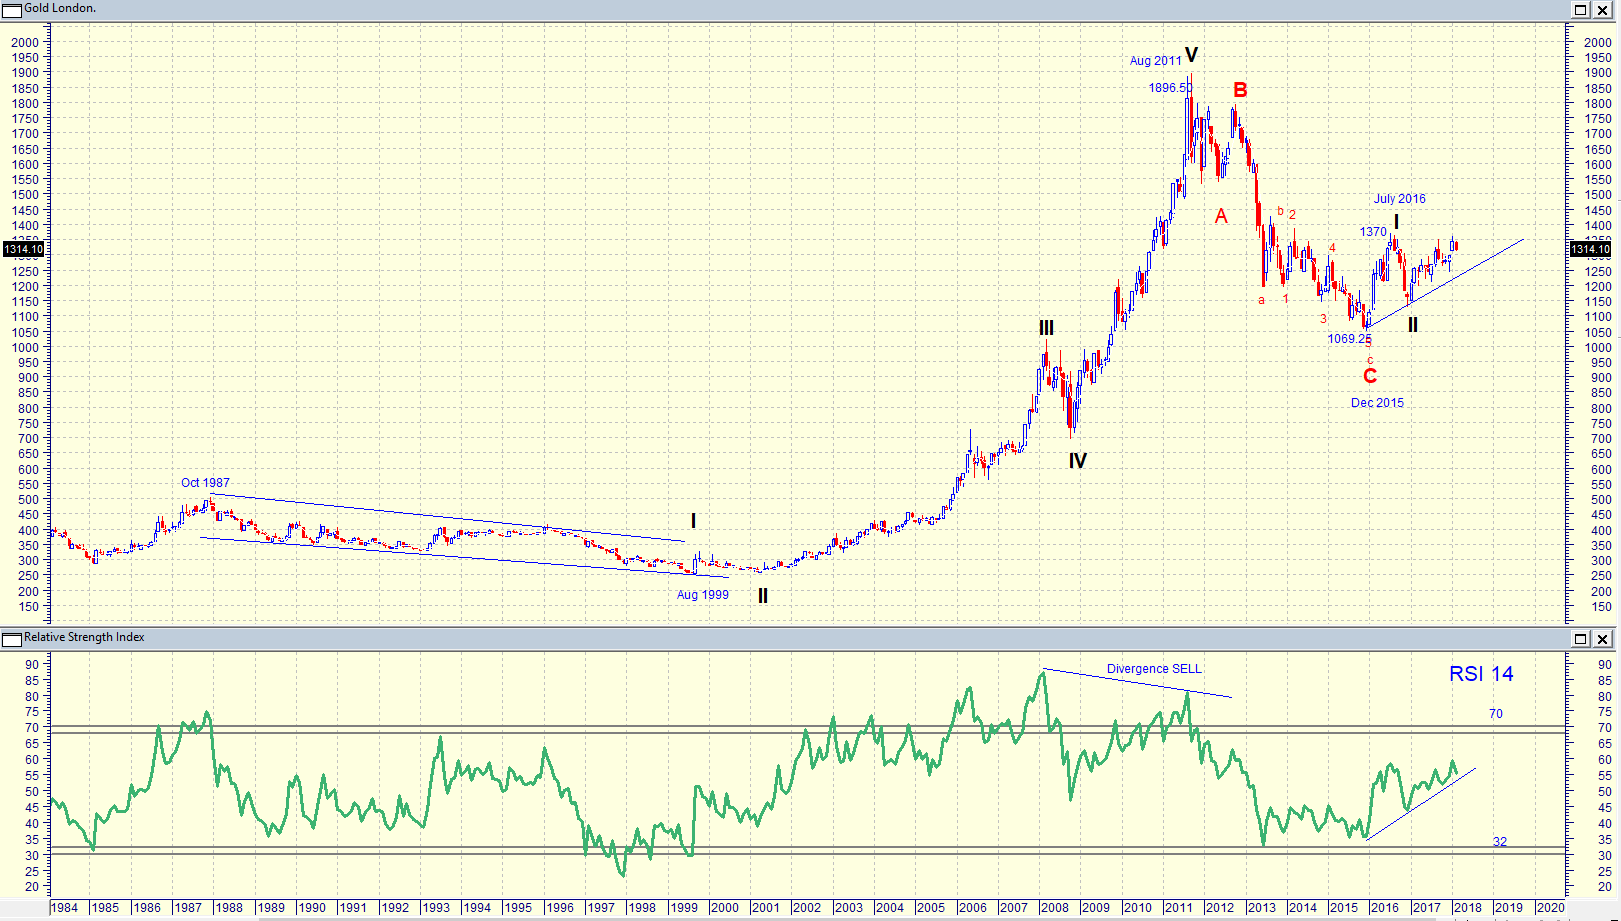
| Figure 1. Monthly chart of London Gold. |
| Graphic provided by: MetaStock. |
| |
| The chart in Figure 1 is a monthly chart of the London Gold price in US, showing how the price of gold started falling in October 1987 bottoming in August 1999. London Gold then rose in 5 Elliott waves topping out in August 2011 at 1896.50. It then fell in an ABC correction bottoming in December 2015. The price of gold now looks as though it could be in a WAVE III uptrend. This is confirmed by the RSI indicator which is in an uptrend. The chart is suggesting that a move above 1370, the high of WAVE I will confirm this. Do note that where the price fell after the 1987 crash, the price of gold at present continues to rise. |

|
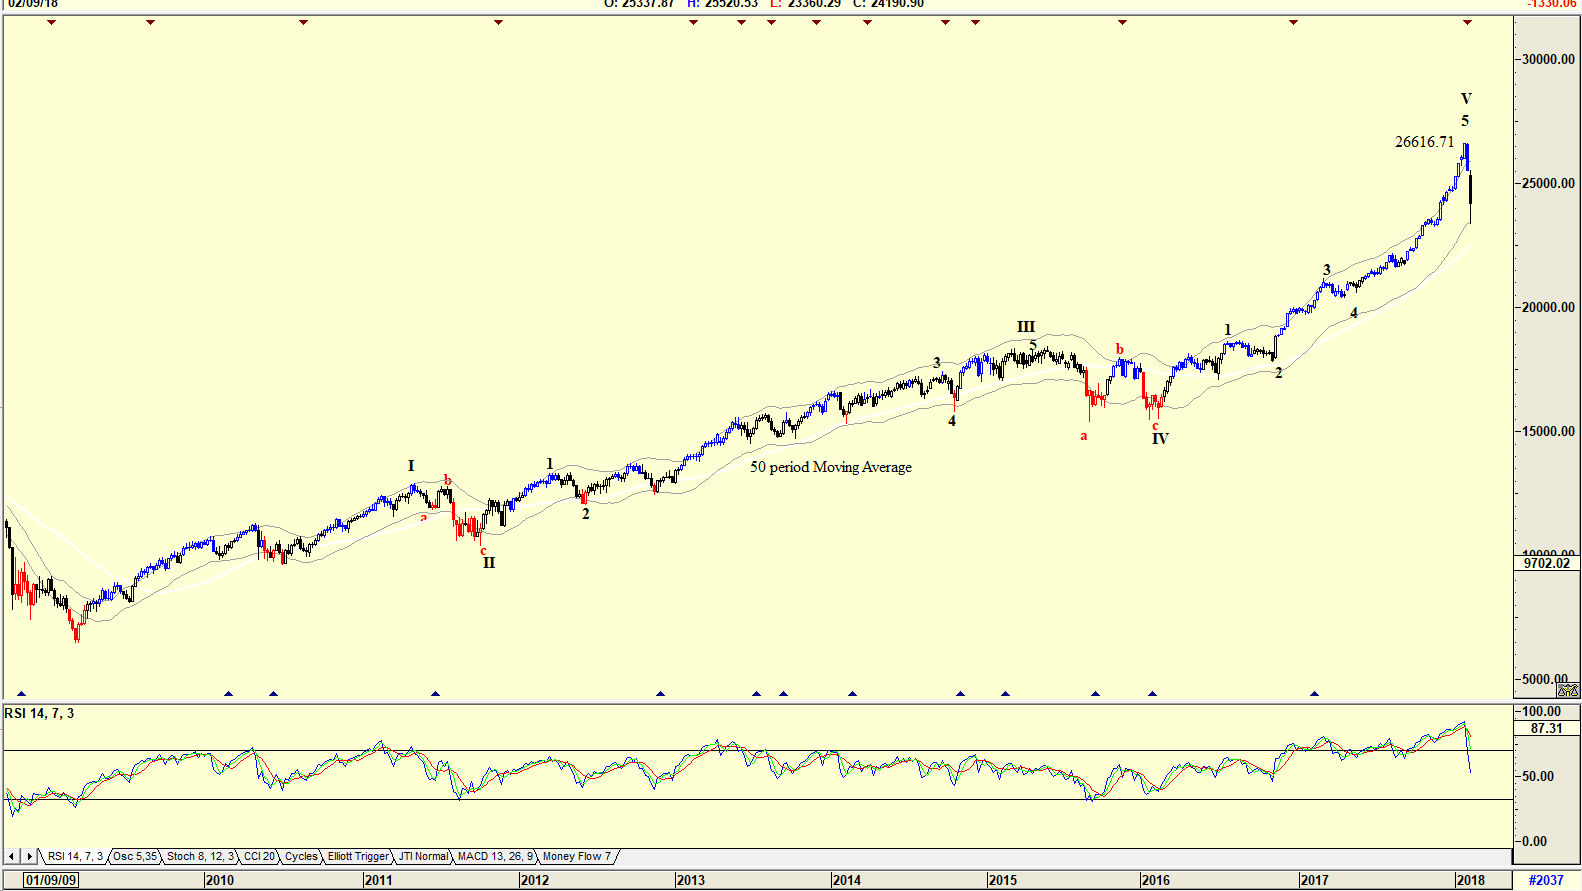
| Figure 2. Weekly chart of the Dow Jones. |
| Graphic provided by: AdvancedGET. |
| |
| The chart in Figure 2 is a weekly chart of the Dow Jones Industrials showing how the price has fallen over the past week. The 14-period RSI has given a sell signal, suggesting that the Index could fall further. Do note the 50-period moving average (200 / 4 = 50) which is the 200-day moving average, an acceptable trigger for a market reversal. |

|
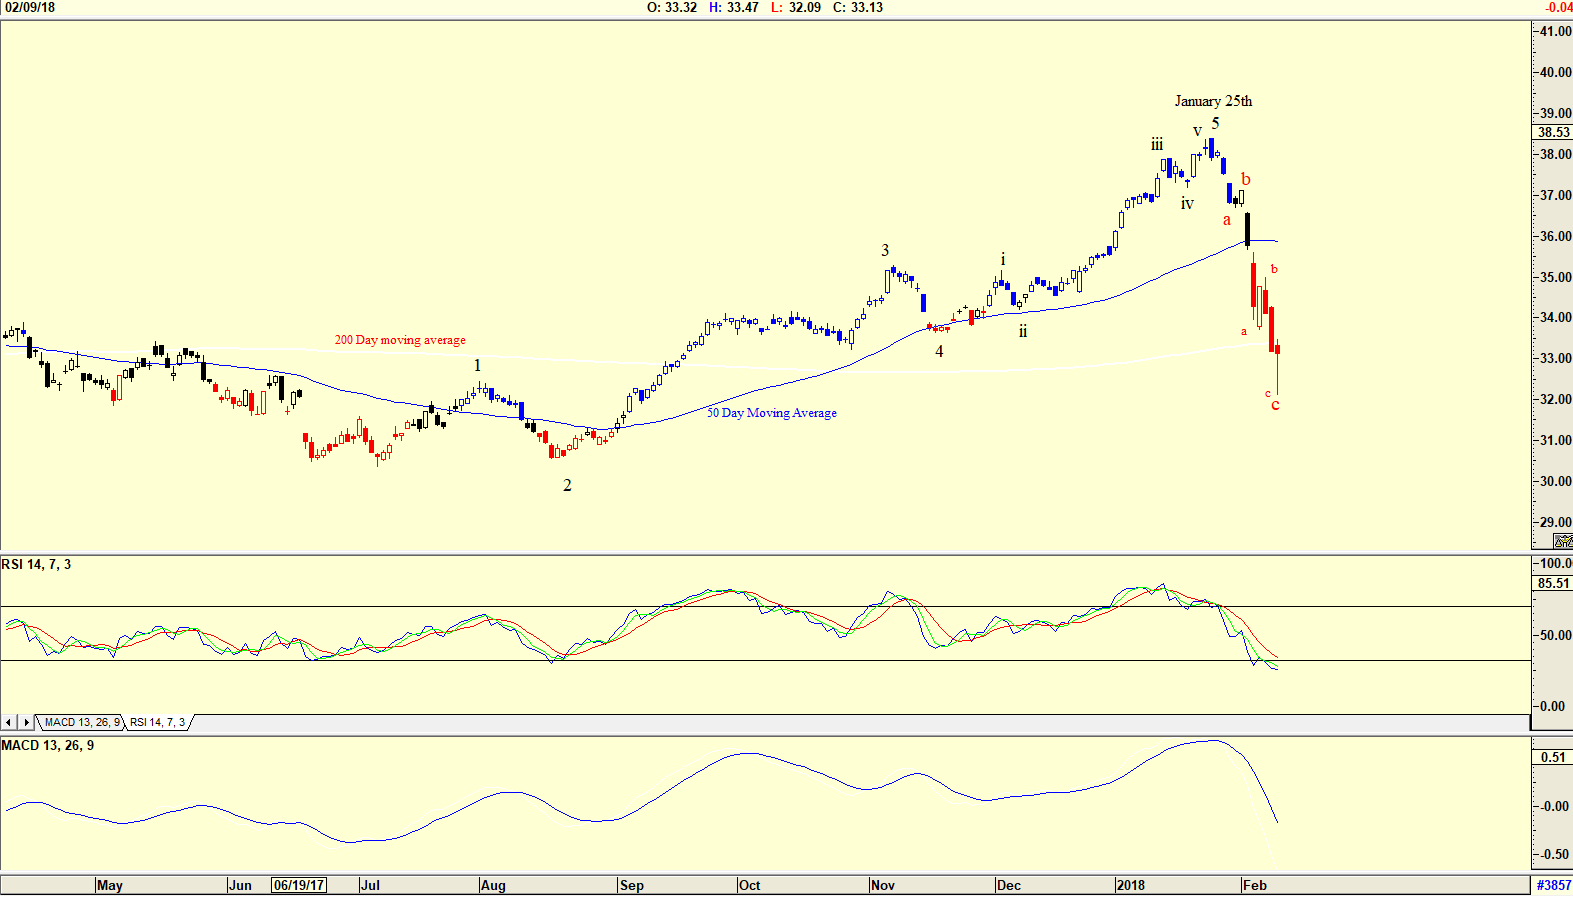
| Figure 3. Daily chart of the iShares Global Energy Sector. |
| Graphic provided by: AdvancedGET. |
| |
| The chart in Figure 3 is a daily chart of the iShares S&P Global Energy Sector. The chart shows how the iShare started correcting on January 25, the same day the Dow corrected. The chart is suggesting an abc Elliott wave count that could be bottoming, falling below the 200-day moving average. The RSI indicator is also at oversold levels with a buy signal in the offing. The MACD indicator is still negative. |

|
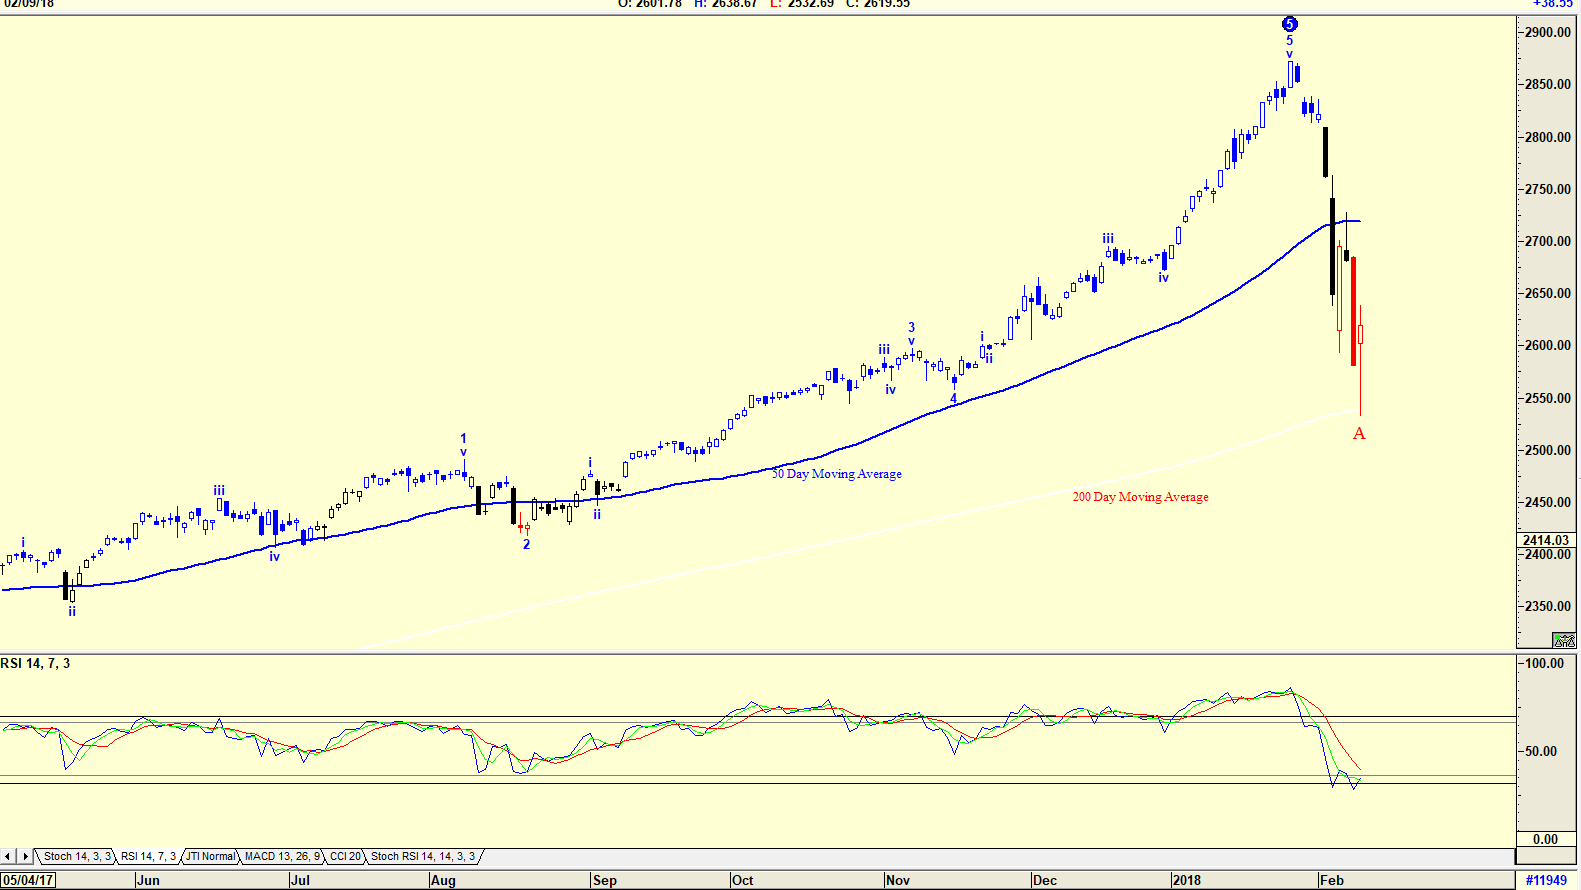
| Figure 4. Daily chart of the S&P500 Index. |
| Graphic provided by: AdvancedGET. |
| |
| The chart in Figure 4 is a daily chart of the S&P500 Index showing that the index found support on the 200-day moving average. Note that the Elliott wave count of the Advanced GET program is suggesting that WAVE 5 has been completed, and that the share has completed a WAVE A correction and should now start rising in a WAVE B. This is confirmed by the RSI indicator which is at oversold levels and could soon suggest a buy. So, with daily charts suggesting a buy, and weekly and monthly charts suggesting further downside, do you buy now or sit and wait? The answer of course is that the Elliott wave, if it has completed an A-Wave correction as suggested by the daily charts, will start rising in a B-Wave before a major crash in a WAVE C. Traders will take advantage of the B-Wave rise. Investors will sell, and look for other avenues to place their money. Buying Gold shares is however out of the question as suggested by the chart in Figure 1. So, where do investors go? |
Has been a technical analyst since 1969, and has worked as a futures and options trader with First Financial Futures in Johannesburg, South Africa.
| Address: | 3256 West 24th Ave |
| Vancouver, BC | |
| Phone # for sales: | 6042634214 |
| E-mail address: | petroosp@gmail.com |
Click here for more information about our publications!
Comments
Date: 02/19/18Rank: 4Comment:

|

Request Information From Our Sponsors
- StockCharts.com, Inc.
- Candle Patterns
- Candlestick Charting Explained
- Intermarket Technical Analysis
- John Murphy on Chart Analysis
- John Murphy's Chart Pattern Recognition
- John Murphy's Market Message
- MurphyExplainsMarketAnalysis-Intermarket Analysis
- MurphyExplainsMarketAnalysis-Visual Analysis
- StockCharts.com
- Technical Analysis of the Financial Markets
- The Visual Investor
- VectorVest, Inc.
- Executive Premier Workshop
- One-Day Options Course
- OptionsPro
- Retirement Income Workshop
- Sure-Fire Trading Systems (VectorVest, Inc.)
- Trading as a Business Workshop
- VectorVest 7 EOD
- VectorVest 7 RealTime/IntraDay
- VectorVest AutoTester
- VectorVest Educational Services
- VectorVest OnLine
- VectorVest Options Analyzer
- VectorVest ProGraphics v6.0
- VectorVest ProTrader 7
- VectorVest RealTime Derby Tool
- VectorVest Simulator
- VectorVest Variator
- VectorVest Watchdog
