HOT TOPICS LIST
- MACD
- Fibonacci
- RSI
- Gann
- ADXR
- Stochastics
- Volume
- Triangles
- Futures
- Cycles
- Volatility
- ZIGZAG
- MESA
- Retracement
- Aroon
INDICATORS LIST
LIST OF TOPICS
PRINT THIS ARTICLE
by Koos van der Merwe
The stock market has fallen heavily over the past few days. Is this the start of the correction predicted by many analysts?
Position: Sell
Koos van der Merwe
Has been a technical analyst since 1969, and has worked as a futures and options trader with First Financial Futures in Johannesburg, South Africa.
PRINT THIS ARTICLE
TECHNICAL ANALYSIS
So, Is This The Start Of The Correction?
02/08/18 03:34:23 PMby Koos van der Merwe
The stock market has fallen heavily over the past few days. Is this the start of the correction predicted by many analysts?
Position: Sell
| The indexes have risen exceptionally strong during President Trump's first year in office. With an almost vertical rise over the past year, many well known and respected voices have been suggesting that the market would correct. The only problem facing them was when the correction would start. With the first correction taking place on January 29, one is inclined to ask, "Why? What is the trigger causing the market to correct?" Of course, many speculate that the collapse of BITCOIN could be the reason. Did crypto currency buyers buy on margin, and now need cash to cover that margin as prices collapsed? Who knows? With the Mueller investigation into the Russian meddling in the US election reaching a climax as those close to President Trump's cabinet are being called in to testify, something that has caused the President to release an FBI memo that is headlining the news, one is not sure. Whatever the reason, the indexes are falling and falling heavily in the worst week in two years. |

|
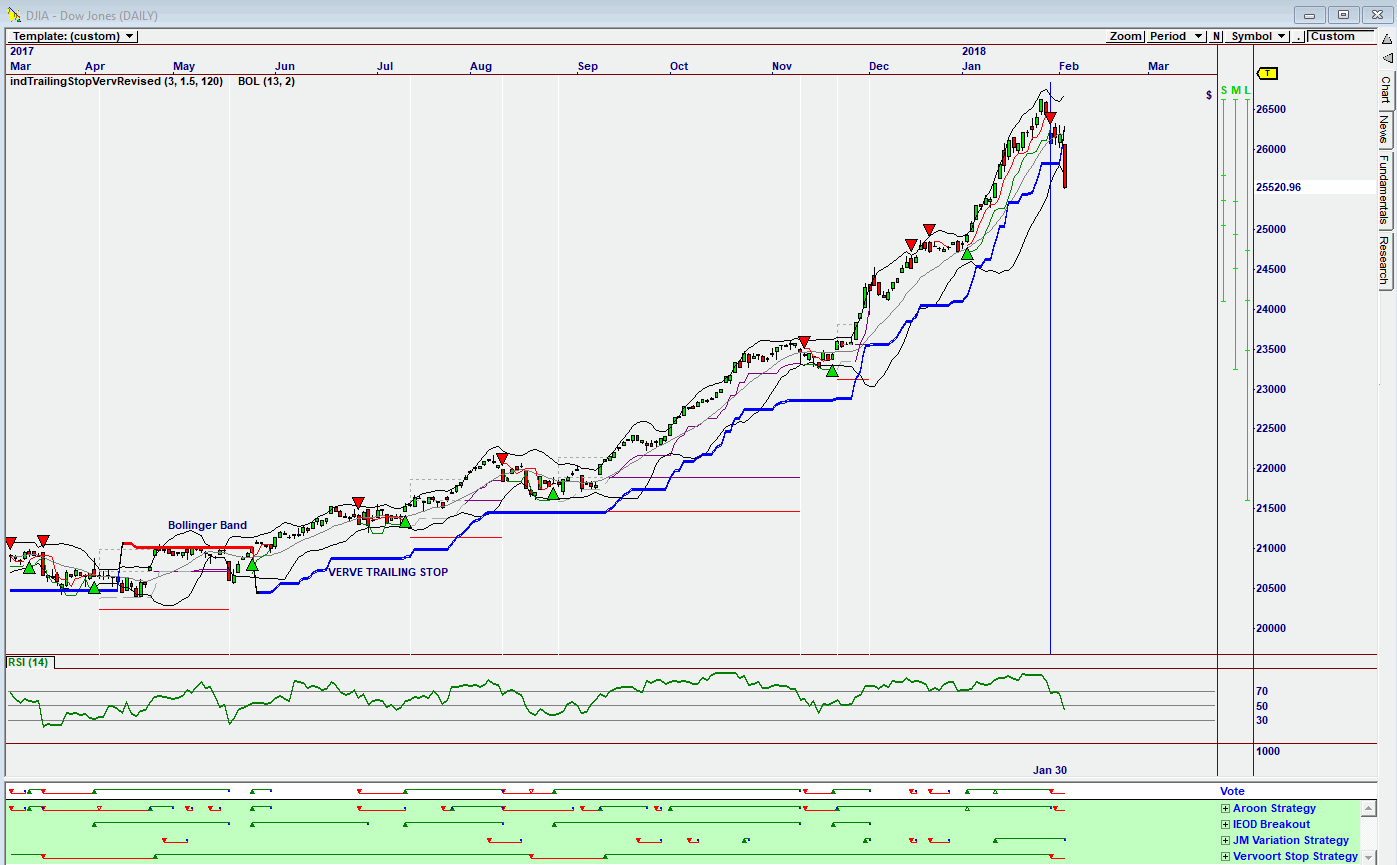
| Figure 1. Daily Omnitrader chart of the Dow Jones Industrial Average. |
| Graphic provided by: Omnitrader. |
| |
| The chart in Figure 1 is a Daily Omnitrader chart of the Dow Jones, showing that a sell signal was given on January 30 as the index broke below the VERVE Trailing Stop. Looking at the strategies below the Vote line, one can see that the sell signal was triggered by the Aroon Strategy and the Vervoort Stop Strategy. The JM Variation Strategy closed out its buy signal, but it did not suggest a sell. Looking back at the history of the index, one can see that the buy/sell signals given on the Vote line have been very accurate. Their only problem is that when the signal is given, there is no suggestion how long the trend may last. One would look at the RSI indicator shown on the chart to get some idea. The indicator suggests that when it falls below the 50 horizontal line, a reversal signal is given. With the indicator presently below the 50 horizontal, the Dow Jones could start bottoming, but one should rather wait for a Vote line buy signal. |

|
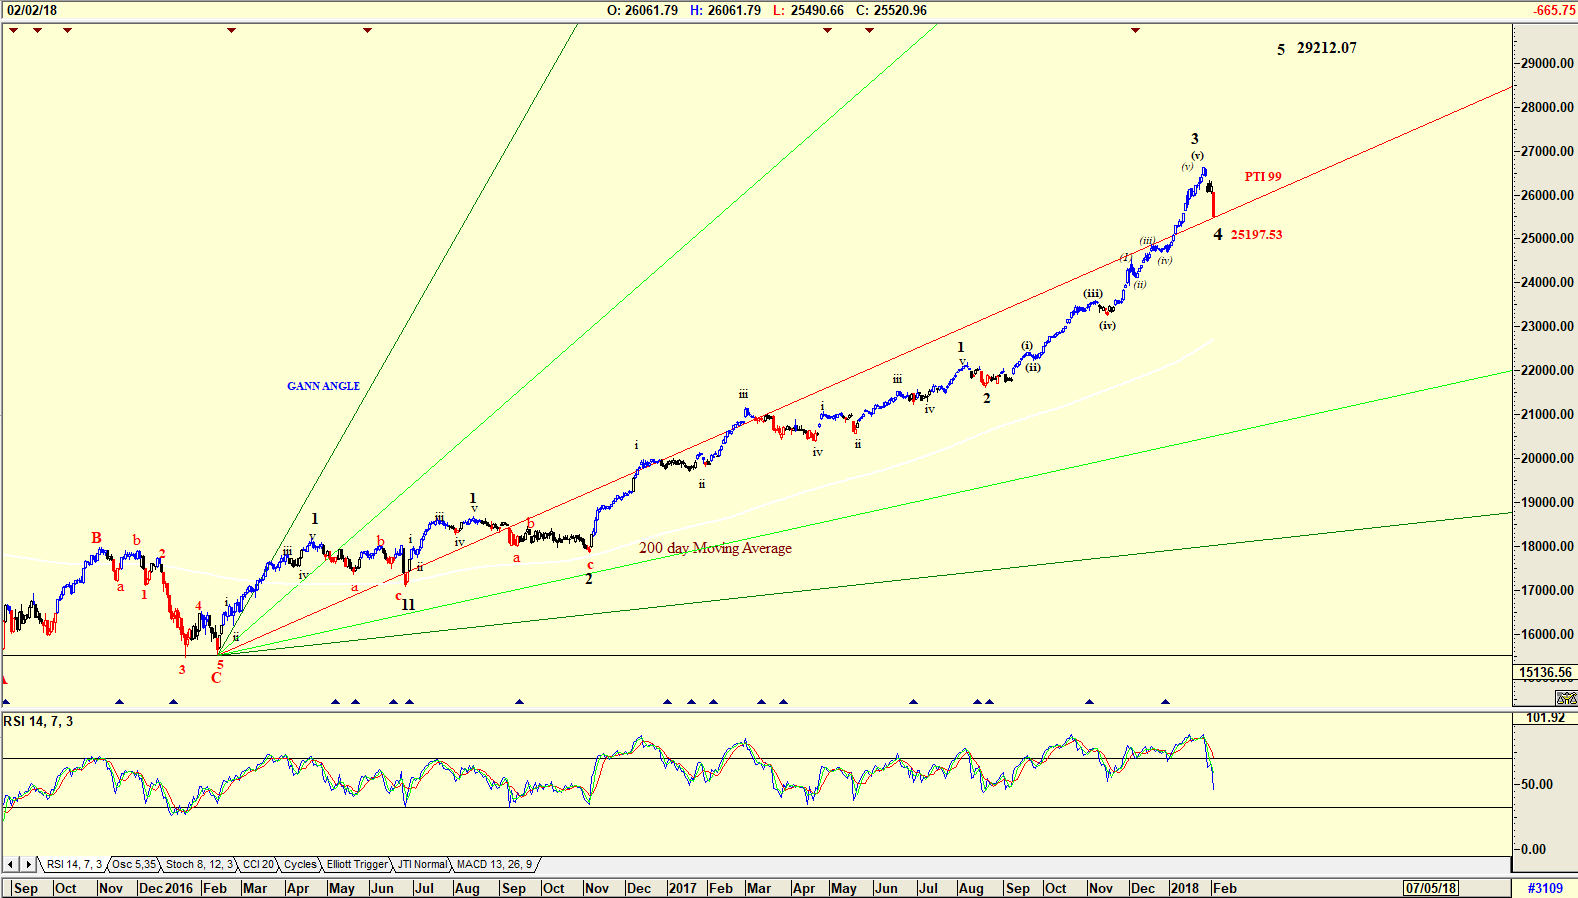
| Figure 2. Daily Advanced GET chart of the Dow. |
| Graphic provided by: AdvancedGET. |
| |
| The chart in Figure 2 is an Advanced GET chart with an Elliott Wave count suggesting that the Dow could be falling in a Wave 4 of a Wave 3 of WAVE III to 25197.53. The Probability Index (PTI) is suggesting 99% that this could happen |

|
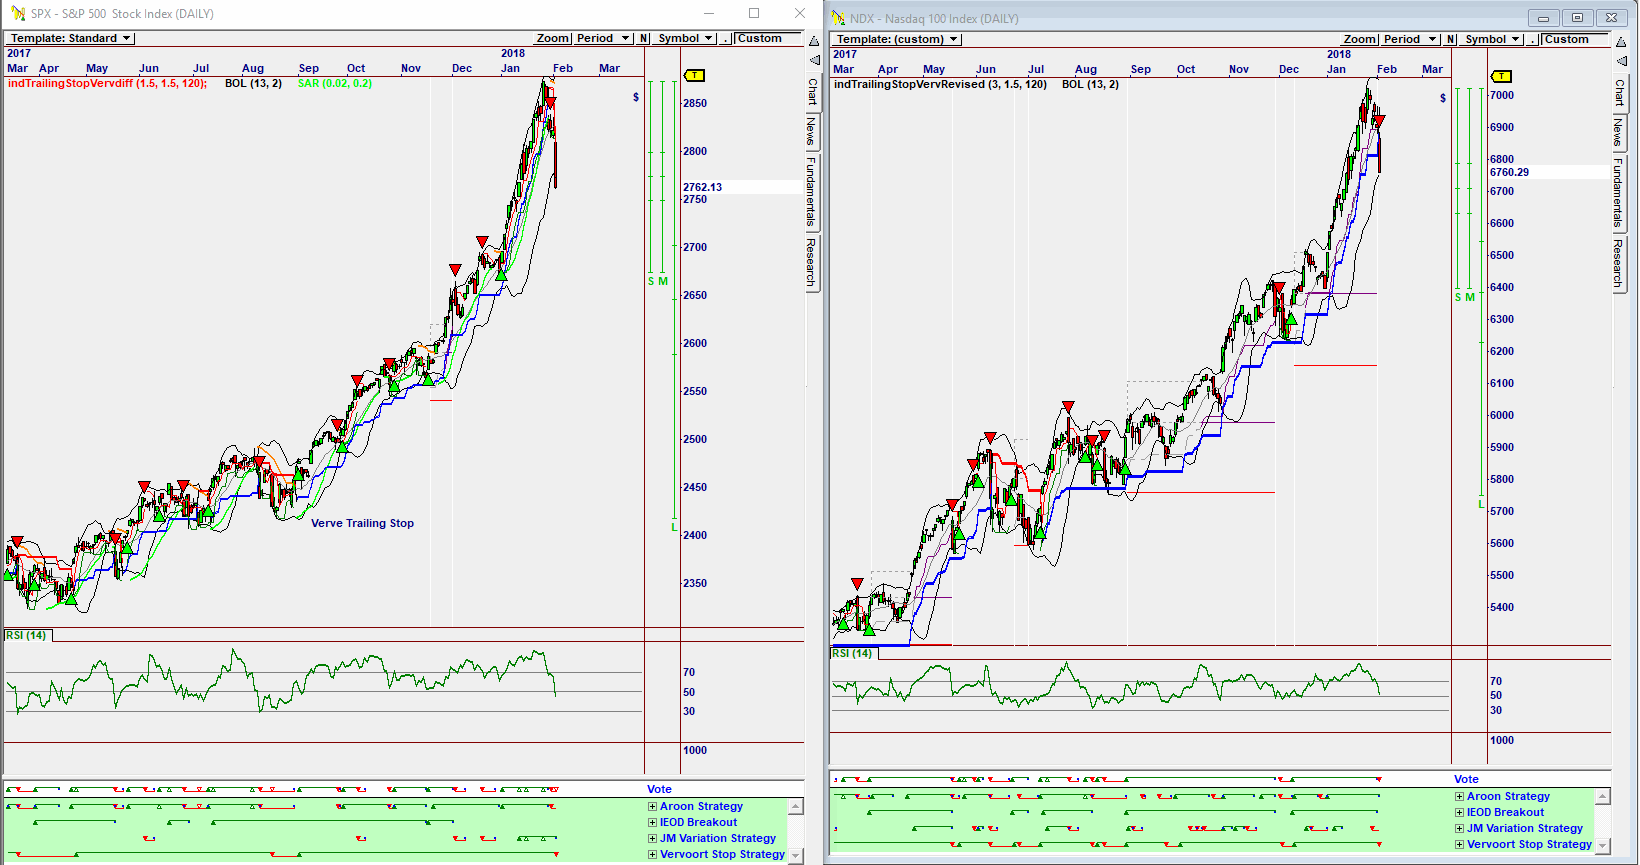
| Figure 3. Charts of the S&P500 and the Nasdaq. |
| Graphic provided by: Omnitrader. |
| |
| The chart in Figure 3 is a daily Omnitrader chart of the S&P 500 Index and the Nasdaq Index. Both show that a sell signal was suggested on January 31, once again based on the Aroon and Vervoort stop strategy. |

|
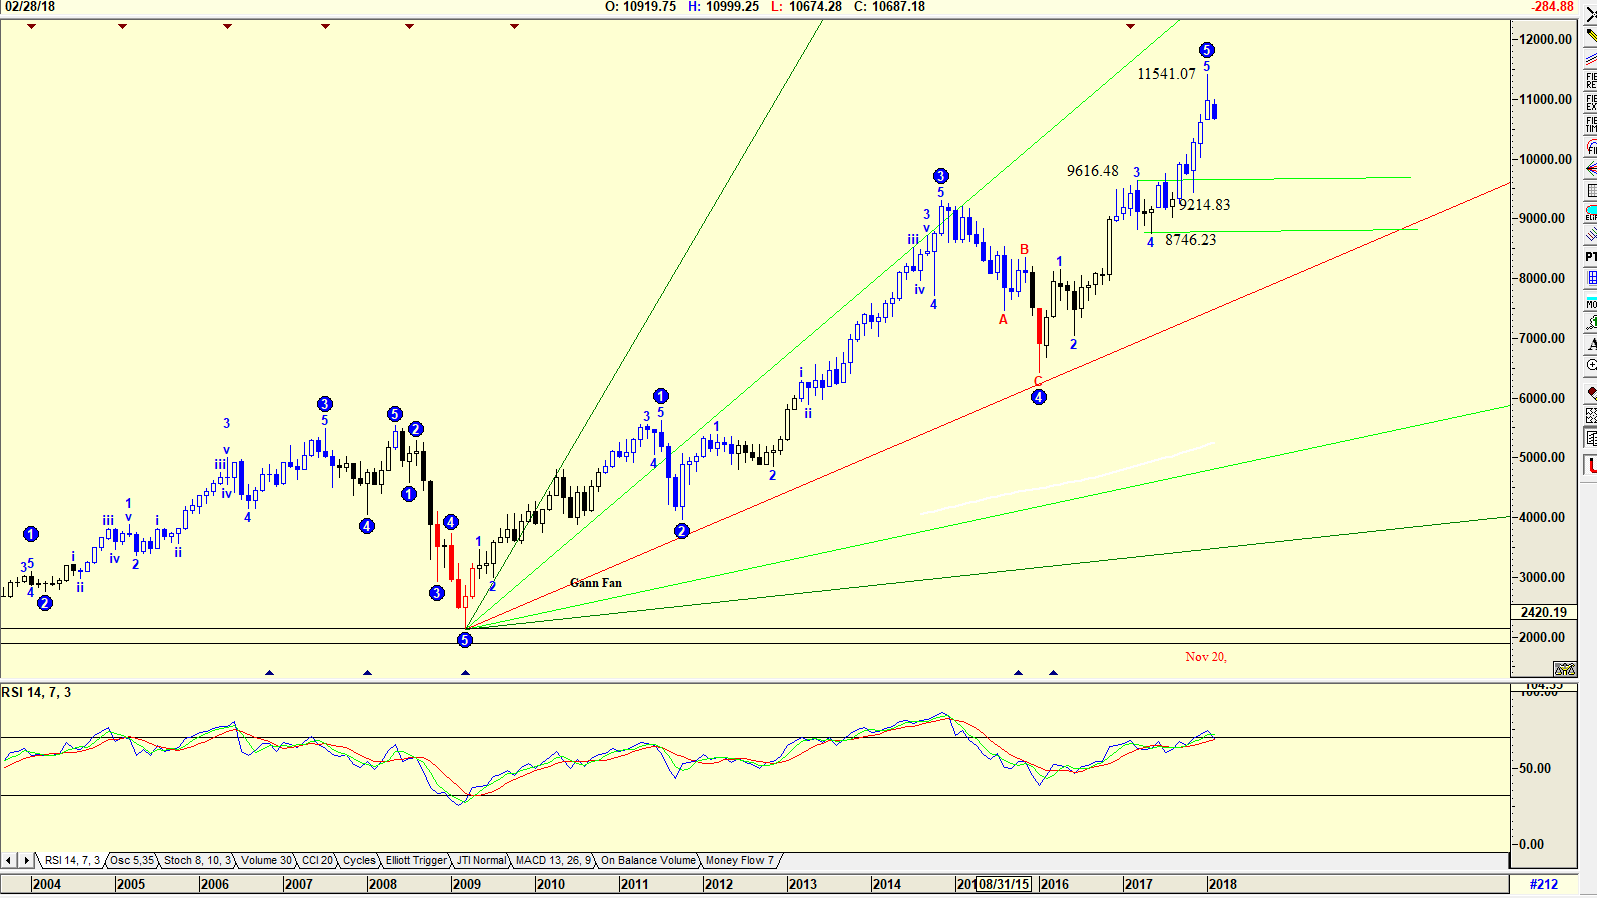
| Figure 4. Monthly chart of the Dow Transportation Index |
| Graphic provided by: AdvancedGET. |
| |
| The chart in Figure 4 is a monthly chart of the Dow Transportation Index with an Elliott wave count suggesting that a WAVE 5 has been completed, and that the index should now correct in an ABC formation to somewhere in the 4th wave of lesser degree ie somewhere between 9616.48 or 8746.23, (midpoint is 9214.83) a drop of 20.15% from the WAVE 5 high of 11541.07. (11541.07-9214.83 = 2326.24. =20.15%). Former Fed Chair, Alan Greenspan who is 91 years old and suffered the 1987 stock market crash after he became Fed Chair in 1987, has stated that stocks and bonds are in a bubble. His thesis is based on widely known facts about a growing fiscal deficit after the Trump administration's tax cuts and the call for more infrastructure spending. The 1987 crash came soon after the Reaganomics tax cuts, a lesson Alan Greenspan has not forgotten. |
Has been a technical analyst since 1969, and has worked as a futures and options trader with First Financial Futures in Johannesburg, South Africa.
| Address: | 3256 West 24th Ave |
| Vancouver, BC | |
| Phone # for sales: | 6042634214 |
| E-mail address: | petroosp@gmail.com |
Click here for more information about our publications!
Comments
Date: 02/08/18Rank: 3Comment:
Date: 02/13/18Rank: 5Comment:

Request Information From Our Sponsors
- StockCharts.com, Inc.
- Candle Patterns
- Candlestick Charting Explained
- Intermarket Technical Analysis
- John Murphy on Chart Analysis
- John Murphy's Chart Pattern Recognition
- John Murphy's Market Message
- MurphyExplainsMarketAnalysis-Intermarket Analysis
- MurphyExplainsMarketAnalysis-Visual Analysis
- StockCharts.com
- Technical Analysis of the Financial Markets
- The Visual Investor
- VectorVest, Inc.
- Executive Premier Workshop
- One-Day Options Course
- OptionsPro
- Retirement Income Workshop
- Sure-Fire Trading Systems (VectorVest, Inc.)
- Trading as a Business Workshop
- VectorVest 7 EOD
- VectorVest 7 RealTime/IntraDay
- VectorVest AutoTester
- VectorVest Educational Services
- VectorVest OnLine
- VectorVest Options Analyzer
- VectorVest ProGraphics v6.0
- VectorVest ProTrader 7
- VectorVest RealTime Derby Tool
- VectorVest Simulator
- VectorVest Variator
- VectorVest Watchdog
