HOT TOPICS LIST
- MACD
- Fibonacci
- RSI
- Gann
- ADXR
- Stochastics
- Volume
- Triangles
- Futures
- Cycles
- Volatility
- ZIGZAG
- MESA
- Retracement
- Aroon
INDICATORS LIST
LIST OF TOPICS
PRINT THIS ARTICLE
by Koos van der Merwe
Even though there are sophisticated programs available that determine cycles and their future projections, I still prefer the simple approach, namely counting the number of days between lows, and projecting them into the future.
Position: Sell
Koos van der Merwe
Has been a technical analyst since 1969, and has worked as a futures and options trader with First Financial Futures in Johannesburg, South Africa.
PRINT THIS ARTICLE
CYCLES
Nasdaq And Cycles
12/16/02 08:47:20 AMby Koos van der Merwe
Even though there are sophisticated programs available that determine cycles and their future projections, I still prefer the simple approach, namely counting the number of days between lows, and projecting them into the future.
Position: Sell
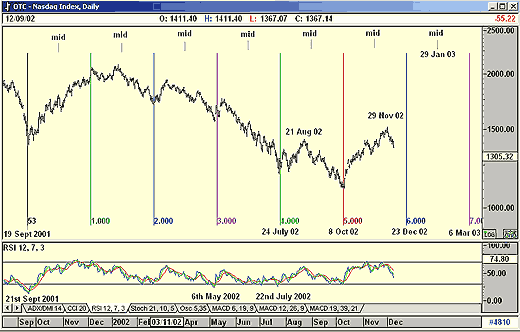
| In my previous article, "Analyzing the S&P 500 Index Using Cycles," I explained how to forecast expected turning points on the S&P 500 index using a simple linear equidistant cycle. For the curious I have projected the identical 53-day cycle onto the Nasdaq. |

|
| Figure 1: Nasdaq and the simple cycle. |
| Graphic provided by: AdvancedGET. |
| |
| In projecting the 53-day cycle onto the Nasdaq index, I found that the same conclusions applied to both the Nasdaq and S&P 500. This was not unexpected, as the various indexes tend to move in tandem. In addition I found that: 1. Both the Nasdaq and the S&P 500 index are in a bull trend because the November 29th high is on the right of the midpoint between cycles lows. At the moment the chart suggests that the index is currently in a correction to this bull trend, a correction that should end on December 23, 2002. 2. From December 23, the index should start rising in the traditional Christmas rally. Should the index truly be in a bull trend, the high should after the January 29th midpoint. My estimate for the high is the 5th of February, 2003, give or take two days on either side. I calculated this date by using the Fibonacci ratio of the distance between the two cycle nodes: Number of trading days from December 23 to March 6, 2003 is 50 days. Multiply this by the Fibonacci ratio: 0.618 = 30.5 = 31 days, add 31 days to December 23 and you get February 5, 2003. 3. From this high point the index should bottom out around March 6, 2003. This is a pretty standard interpretation of a cycle based of past history. As I mentioned before, I prefer the simple approach of counting the number of days between lows and projecting them into the future, but not too far into the future, as nothing is cast in stone, especially in today's volatile world markets. |
Has been a technical analyst since 1969, and has worked as a futures and options trader with First Financial Futures in Johannesburg, South Africa.
| Address: | 3256 West 24th Ave |
| Vancouver, BC | |
| Phone # for sales: | 6042634214 |
| E-mail address: | petroosp@gmail.com |
Click here for more information about our publications!
Comments
Date: 12/17/02Rank: 5Comment: xcellent article. It would be great if you could complete the series by analysing Dow!
Date: 12/17/02Rank: 5Comment: xcellent article. It would be great if you could complete the series by analysing Dow!
Date: 12/17/02Rank: 5Comment: should it read 29th Nov? I guess there is a typing error stating 29 dec! in point no 1.
Date: 12/17/02Rank: 4Comment:
Date: 12/17/02Rank: Comment: It would be most helpful if an author would print a link to any previous articles which s/he mentions.
Date: 12/17/02Rank: 4Comment:
Date: 12/19/02Rank: 4Comment:

|

Request Information From Our Sponsors
- StockCharts.com, Inc.
- Candle Patterns
- Candlestick Charting Explained
- Intermarket Technical Analysis
- John Murphy on Chart Analysis
- John Murphy's Chart Pattern Recognition
- John Murphy's Market Message
- MurphyExplainsMarketAnalysis-Intermarket Analysis
- MurphyExplainsMarketAnalysis-Visual Analysis
- StockCharts.com
- Technical Analysis of the Financial Markets
- The Visual Investor
- VectorVest, Inc.
- Executive Premier Workshop
- One-Day Options Course
- OptionsPro
- Retirement Income Workshop
- Sure-Fire Trading Systems (VectorVest, Inc.)
- Trading as a Business Workshop
- VectorVest 7 EOD
- VectorVest 7 RealTime/IntraDay
- VectorVest AutoTester
- VectorVest Educational Services
- VectorVest OnLine
- VectorVest Options Analyzer
- VectorVest ProGraphics v6.0
- VectorVest ProTrader 7
- VectorVest RealTime Derby Tool
- VectorVest Simulator
- VectorVest Variator
- VectorVest Watchdog
