HOT TOPICS LIST
- MACD
- Fibonacci
- RSI
- Gann
- ADXR
- Stochastics
- Volume
- Triangles
- Futures
- Cycles
- Volatility
- ZIGZAG
- MESA
- Retracement
- Aroon
INDICATORS LIST
LIST OF TOPICS
PRINT THIS ARTICLE
by Koos van der Merwe
The saying goes, "when in doubt, get out."
Position: Accumulate
Koos van der Merwe
Has been a technical analyst since 1969, and has worked as a futures and options trader with First Financial Futures in Johannesburg, South Africa.
PRINT THIS ARTICLE
TECHNICAL ANALYSIS
Looking For Income
02/01/18 04:09:52 PMby Koos van der Merwe
The saying goes, "when in doubt, get out."
Position: Accumulate
| The stock market has started the year 2018 with enthusiasm after a stellar 2017. For a third week in a row, stocks were higher, looking stronger than ever. What could go wrong in a market that is red-hot? When one looks at the movement of the Dow, in just seven days it jumped from 25,000 to 26,000. Then, on Friday night, January 19, the government officially shut down. Admittedly, the federal government may be shut down, but the House and Senate are still in session over the weekend attempting to reach a last minute deal to re-open it. This insecurity may affect the market on Monday, January 22, and could be the start of a market meltdown. If this does truly happen, where does one put one's money? The answer, of course, is into income bearing stocks, or those stocks that are catching one's attention. |

|
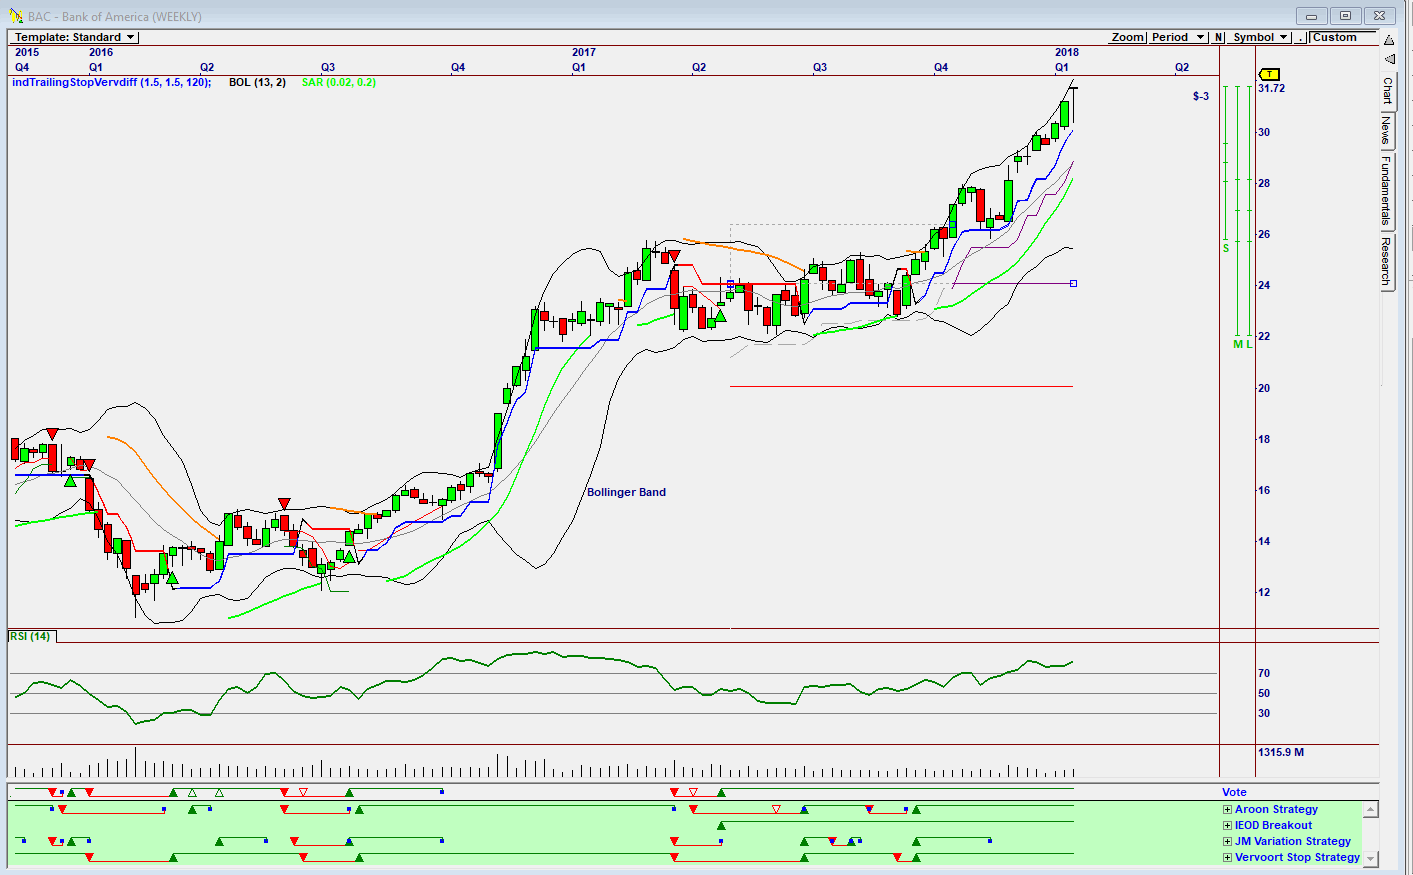
| Figure 1. Weekly chart of Bank of America. |
| Graphic provided by: Omnitrader. |
| |
| A stock that over the past year rose strongly is Bank Of America. Admittedly, the dividend yield of 1.51% is low, but the share has performed well since 2016. The chart in Figure 1 is a weekly chart showing how strongly the share has moved over the past two years. Will it continue performing should there be a market correction? I doubt it, but it is a share to watch and buy when, after a correction, the share starts recovering. Do note the buy and sell signals suggested on the Vote line. The RSI Indicator is at overbought levels. |

|
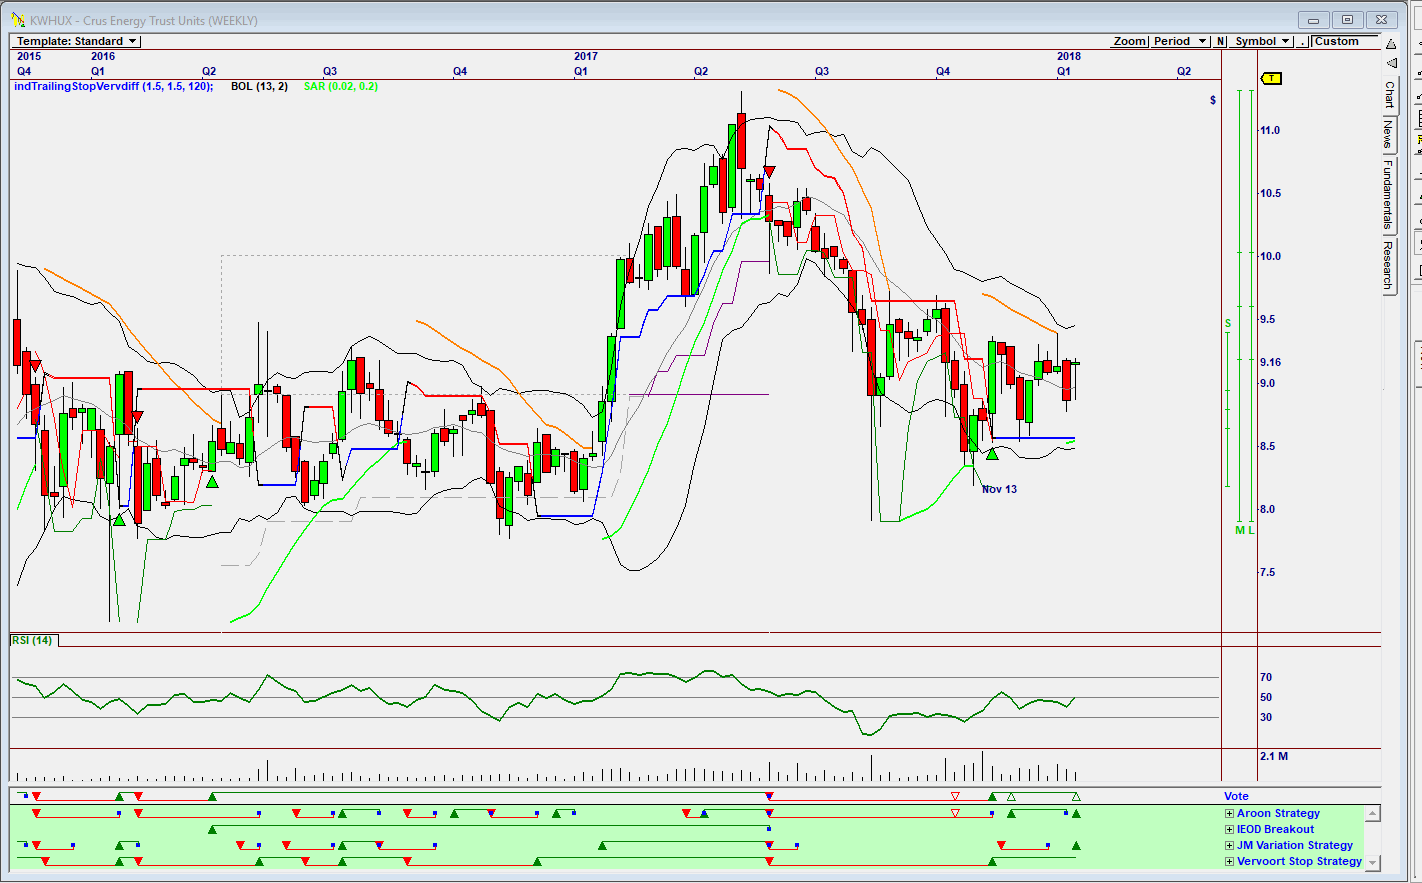
| Figure 2. Weekly chart of Crus Energy Trust. |
| Graphic provided by: Omnitrader. |
| |
| Looking at a weekly chart of the Canadian share, Crus Energy Trust, one can see a share that in 2017 moved up strongly and then fell strongly. So why watch it? Well, at the present price, Crus Energy Trust is offering a yield of 8.96%. The weekly chart shown in Figure 2 gave a buy signal during the week ending November 13, as shown on the Vote line. Watching the share, and looking for a correction, one should buy the share, and hold it. Possibly for the long term. |

|
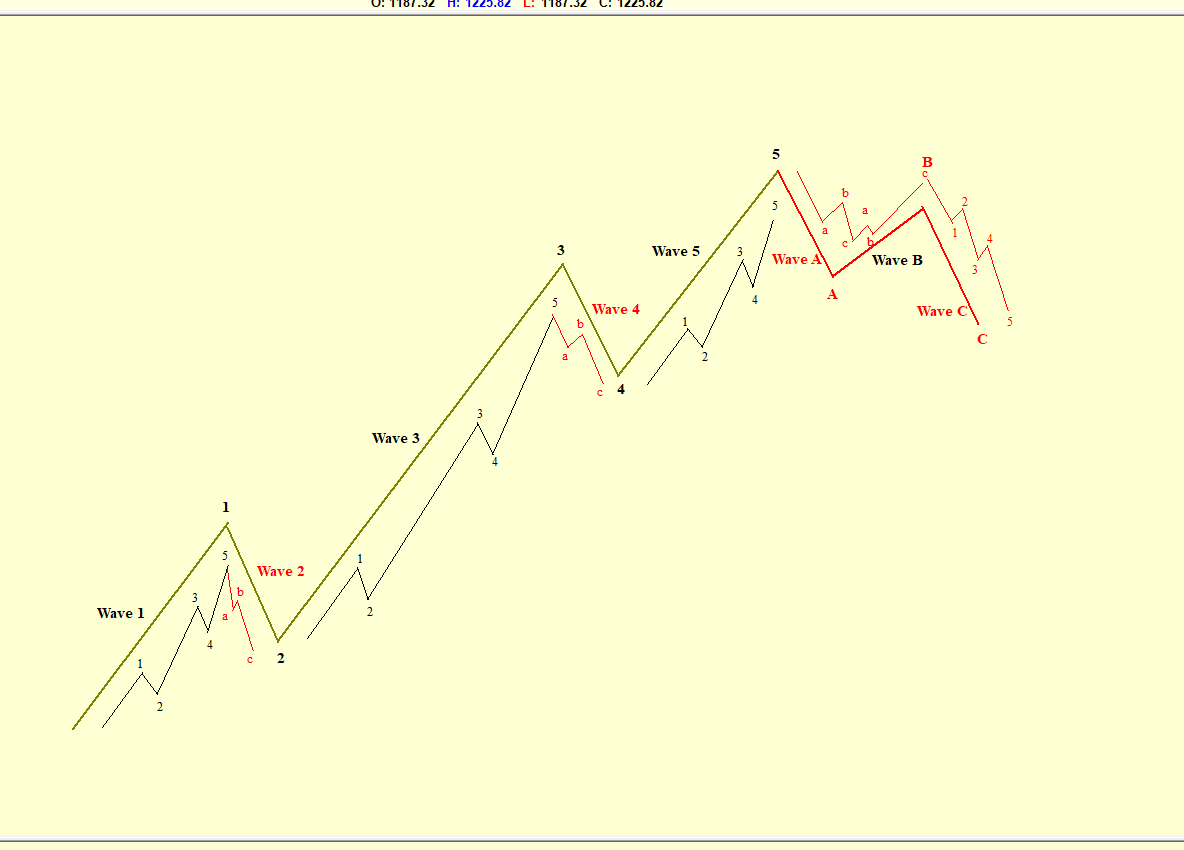
| Figure 3. Basic Elliott wave pattern. |
| Graphic provided by: AdvancedGET. |
| |
| The chart in Figure 3 is a basic chart of the Elliott wave. The chart shows that after an A-WAVE correction, a B-WAVE rises, before the C-WAVE meltdown. There are many more shares that offer a good income; shares that one should buy on a market correction and hold for the long term. Elliott wave suggests that after the A-WAVE correction, the Indexes will strengthen in a B-WAVE. It is during this "up" correction that one should move 100% to cash or bonds that offer a safe in reasonable income. |
Has been a technical analyst since 1969, and has worked as a futures and options trader with First Financial Futures in Johannesburg, South Africa.
| Address: | 3256 West 24th Ave |
| Vancouver, BC | |
| Phone # for sales: | 6042634214 |
| E-mail address: | petroosp@gmail.com |
Click here for more information about our publications!
PRINT THIS ARTICLE

Request Information From Our Sponsors
- StockCharts.com, Inc.
- Candle Patterns
- Candlestick Charting Explained
- Intermarket Technical Analysis
- John Murphy on Chart Analysis
- John Murphy's Chart Pattern Recognition
- John Murphy's Market Message
- MurphyExplainsMarketAnalysis-Intermarket Analysis
- MurphyExplainsMarketAnalysis-Visual Analysis
- StockCharts.com
- Technical Analysis of the Financial Markets
- The Visual Investor
- VectorVest, Inc.
- Executive Premier Workshop
- One-Day Options Course
- OptionsPro
- Retirement Income Workshop
- Sure-Fire Trading Systems (VectorVest, Inc.)
- Trading as a Business Workshop
- VectorVest 7 EOD
- VectorVest 7 RealTime/IntraDay
- VectorVest AutoTester
- VectorVest Educational Services
- VectorVest OnLine
- VectorVest Options Analyzer
- VectorVest ProGraphics v6.0
- VectorVest ProTrader 7
- VectorVest RealTime Derby Tool
- VectorVest Simulator
- VectorVest Variator
- VectorVest Watchdog
