HOT TOPICS LIST
- MACD
- Fibonacci
- RSI
- Gann
- ADXR
- Stochastics
- Volume
- Triangles
- Futures
- Cycles
- Volatility
- ZIGZAG
- MESA
- Retracement
- Aroon
INDICATORS LIST
LIST OF TOPICS
PRINT THIS ARTICLE
by Koos van der Merwe
The market keeps going up and up and up, in spite of the negativity suggested by many top experts.
Position: Accumulate
Koos van der Merwe
Has been a technical analyst since 1969, and has worked as a futures and options trader with First Financial Futures in Johannesburg, South Africa.
PRINT THIS ARTICLE
A Few Shares To Watch
01/25/18 04:10:15 PMby Koos van der Merwe
The market keeps going up and up and up, in spite of the negativity suggested by many top experts.
Position: Accumulate
| Many fundamentalists and technical analysts out there are calling for a market correction. Looking at charts of the major indices, whether by Elliott wave analysis, Gann charts or any other analytical form out there, either technical or fundamental, the major indices continue to rise as money pours into shares. So, looking for a buy, which shares should you look at? That of course depends on the analytical program you use. As for me, I use Advanced GET and Omnitrader with strategies that tell me which shares to watch. Below are a few to keep an eye on. |

|
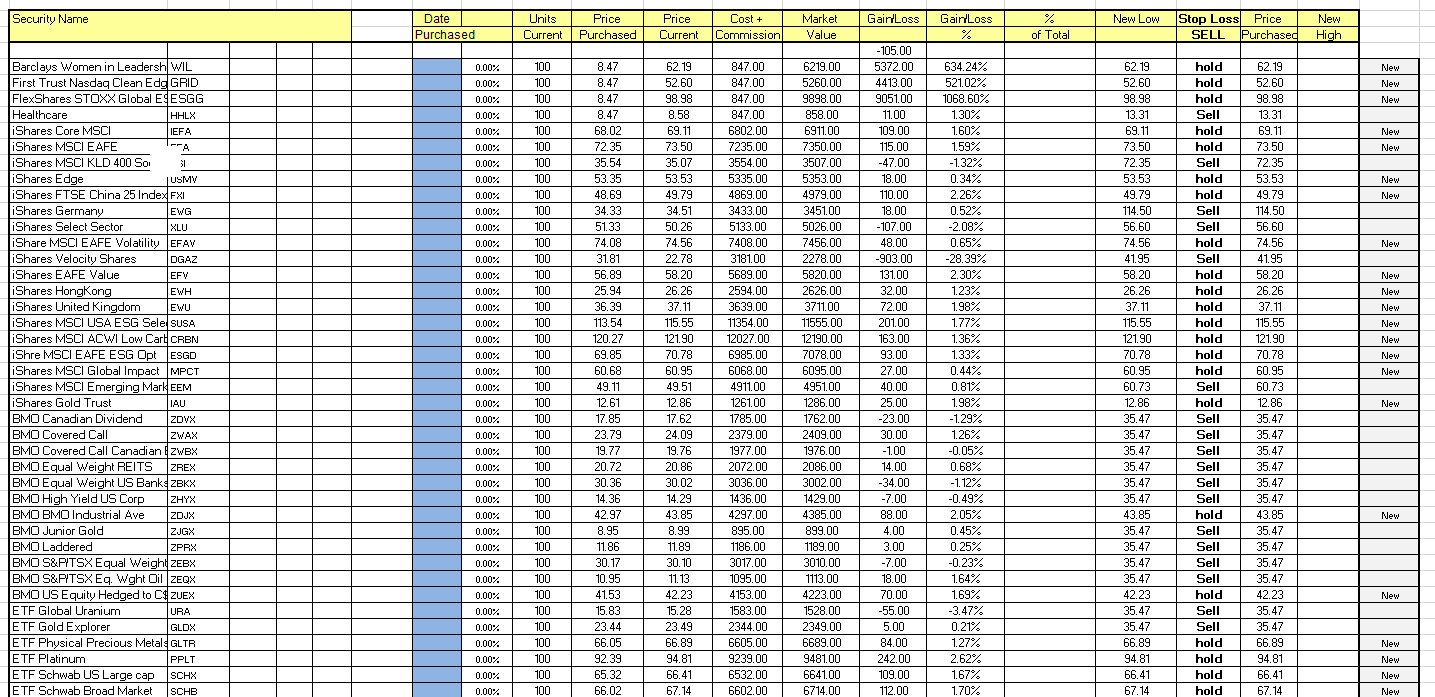
| Figure 1. List of some of the ETFs I watch. |
| Graphic provided by: Microsoft Excel. |
| |
| My first chart in Figure 1 is a list of some of the ETFs I watch. Do note in the last column the NEW highs shown. This gives me an idea of which shares I should keep an eye on using the Advances GET or Omnitrader programs. I must add that I am becoming an ETF fan, simply because they do not fluctuate as much as ordinary shares which are business orientated, or influenced by political feelings. |

|
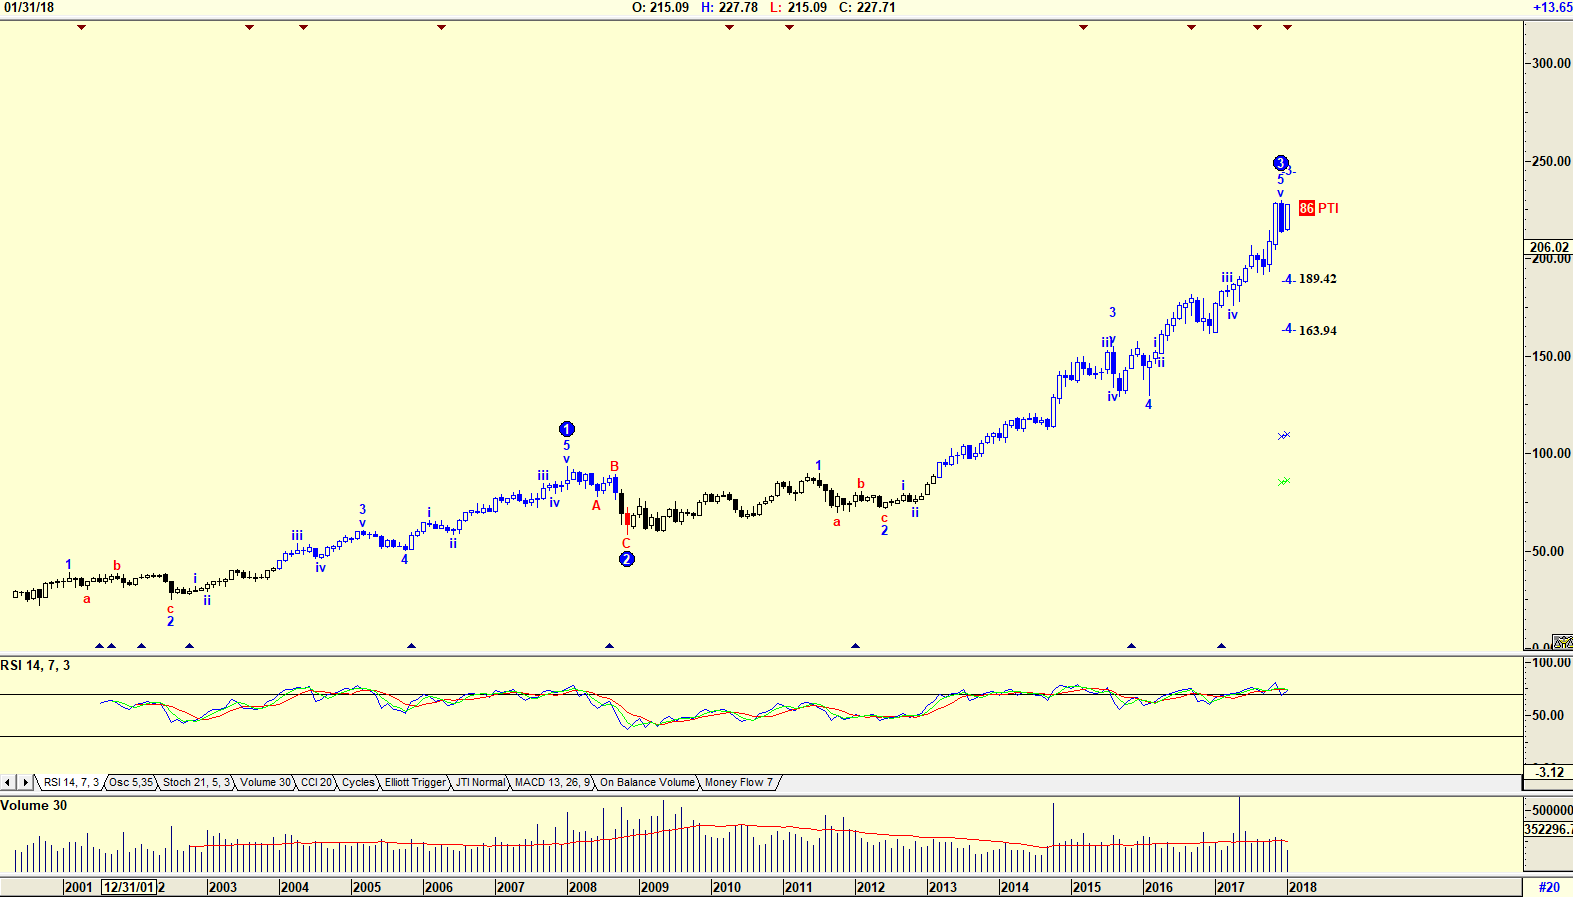
| Figure 2. Monthly Advanced GET with Elliott wave. |
| Graphic provided by: AdvancedGET. |
| |
| The chart in Figure 2 is an Advanced GET monthly chart of Beaton Dickenson Inc. (BDX). The chart suggests that the share price is in an Elliott wave 3 and could fall to 189.42 or 163.94 in a Wave 4 correction. This gives one a buying opportunity. The PTI of 86 shown on the chart suggests that there is an 86% probability that the share price will rise in a WAVE 5 once the wave 4 has been completed. Do note the RSI indicator which is at overbought levels. Also note the volume, which is strong. |

|
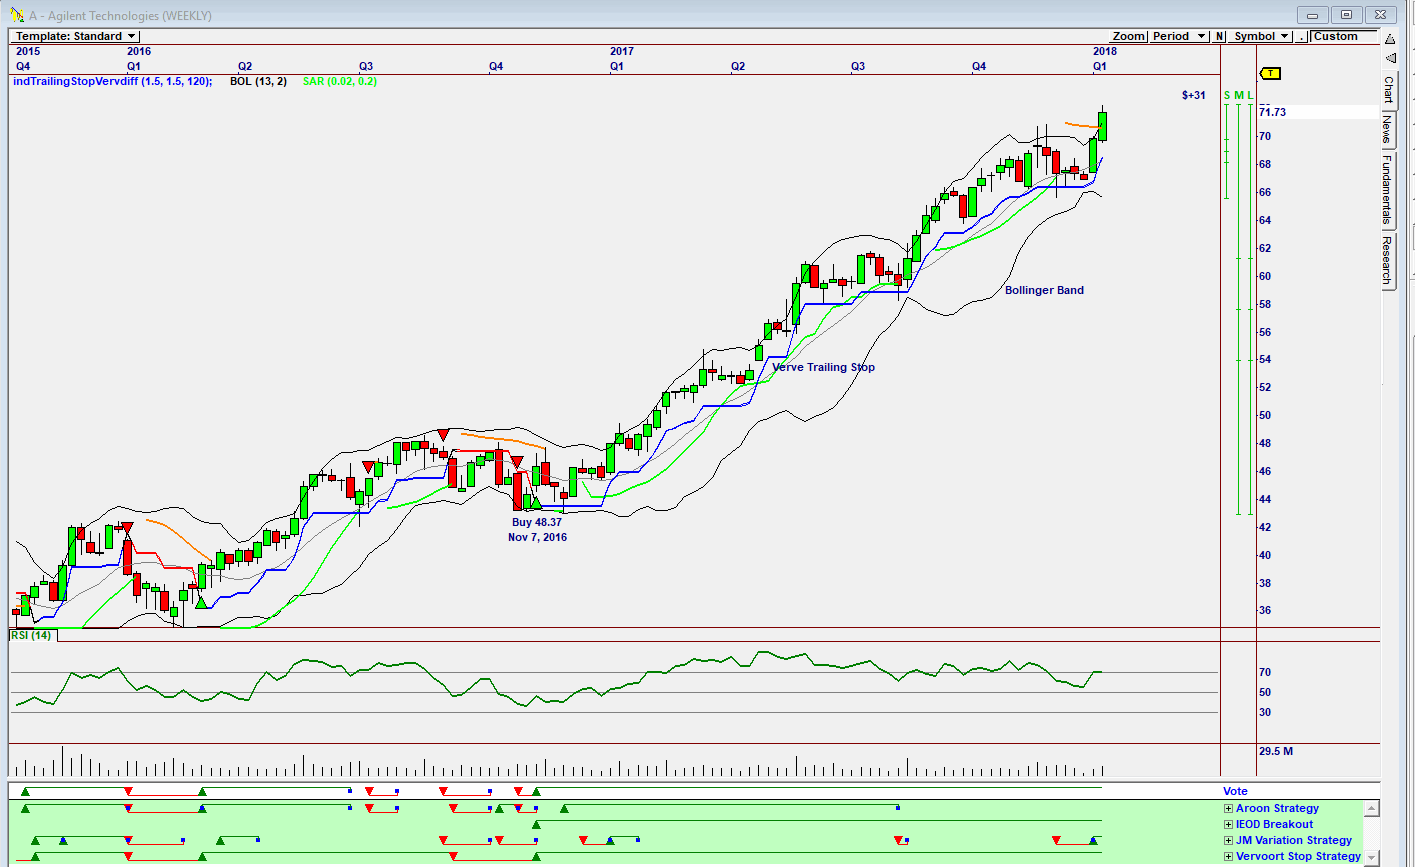
| Figure 3. Omnitrader chart showing analysis. |
| Graphic provided by: Omnitrader. |
| |
| The chart in Figure 3 is an Omnitrader weekly chart of Agilent Technologies. Do note the buy signal given on November 7, 2016 when the share price was $48.37. With its present price at $71.73 it would have been a sound investment. The buy shown on the Vote line is based on the IEOD and Vervoort Stop Strategies. Do note how the RSI indicator remained at overbought levels giving the occasional sell signal. With the Indices continually rising to new market highs there are many shares out there that should be bought and held. Identifying which share to buy depends on the program and indicators you use to identify that share. I have shown you a few of those I use to keep me happy. |
Has been a technical analyst since 1969, and has worked as a futures and options trader with First Financial Futures in Johannesburg, South Africa.
| Address: | 3256 West 24th Ave |
| Vancouver, BC | |
| Phone # for sales: | 6042634214 |
| E-mail address: | petroosp@gmail.com |
Click here for more information about our publications!
PRINT THIS ARTICLE

Request Information From Our Sponsors
- StockCharts.com, Inc.
- Candle Patterns
- Candlestick Charting Explained
- Intermarket Technical Analysis
- John Murphy on Chart Analysis
- John Murphy's Chart Pattern Recognition
- John Murphy's Market Message
- MurphyExplainsMarketAnalysis-Intermarket Analysis
- MurphyExplainsMarketAnalysis-Visual Analysis
- StockCharts.com
- Technical Analysis of the Financial Markets
- The Visual Investor
- VectorVest, Inc.
- Executive Premier Workshop
- One-Day Options Course
- OptionsPro
- Retirement Income Workshop
- Sure-Fire Trading Systems (VectorVest, Inc.)
- Trading as a Business Workshop
- VectorVest 7 EOD
- VectorVest 7 RealTime/IntraDay
- VectorVest AutoTester
- VectorVest Educational Services
- VectorVest OnLine
- VectorVest Options Analyzer
- VectorVest ProGraphics v6.0
- VectorVest ProTrader 7
- VectorVest RealTime Derby Tool
- VectorVest Simulator
- VectorVest Variator
- VectorVest Watchdog
