HOT TOPICS LIST
- MACD
- Fibonacci
- RSI
- Gann
- ADXR
- Stochastics
- Volume
- Triangles
- Futures
- Cycles
- Volatility
- ZIGZAG
- MESA
- Retracement
- Aroon
INDICATORS LIST
LIST OF TOPICS
PRINT THIS ARTICLE
by Stella Osoba, CMT
Sometimes a stock's price will move so far away from its simple moving average (SMA) that the temptation is to trade in the opposite direction. The idea underlying these trades is that stock prices will always revert to their mean. Right? Maybe.
Position: N/A
Stella Osoba, CMT
Stella Osoba is a trader and financial writer. She is a frequent contributor to "Technical Analysis of Stocks and Commodities" magazine and "Traders.com Advantage" as well as other financial publications.
PRINT THIS ARTICLE
TECHNICAL ANALYSIS
Momentum and Simple Moving Averages
01/25/18 04:04:05 PMby Stella Osoba, CMT
Sometimes a stock's price will move so far away from its simple moving average (SMA) that the temptation is to trade in the opposite direction. The idea underlying these trades is that stock prices will always revert to their mean. Right? Maybe.
Position: N/A
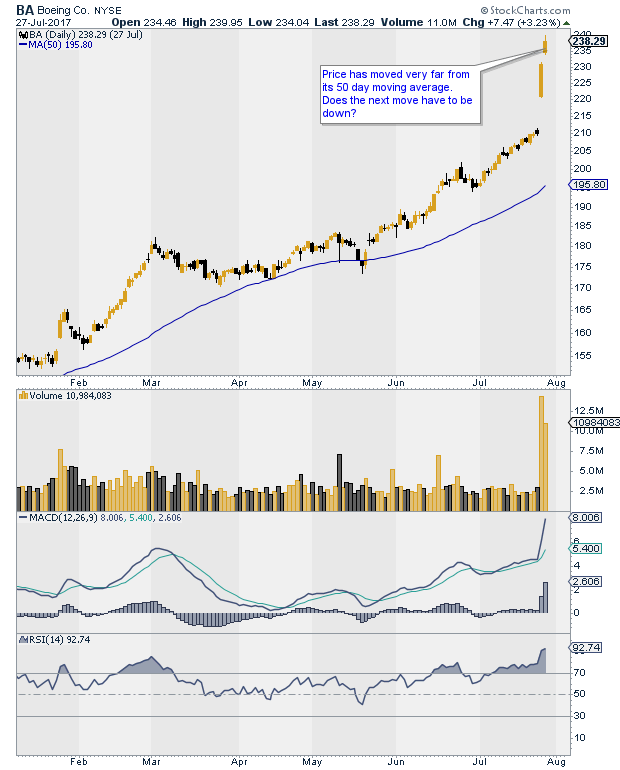
| In 2017, Boeing (BA) was one of the best performing blue chips in the DOW. If we take a snap shot of the stock's performance (see Figure 1) from February to July of 2017, we can see that the stock was on a sustained uptrend. The uptrend accelerated at the end of July and gapped up on very strong volume closing the day with a strong bullish candle. Strong momentum continued into the next day creating another gap up and bullish candle. The effect of these strong bullish gapping candles caused the stock to move at what seemed to be an extreme from its 50-day SMA. While those bulls who had been in the stock before the gap up might have been celebrating wins, more cautious bears were probably looking at the space between the 50-day SMA and price, and thinking, this seems like a good time to short, after all, reversion to the mean principles suggest that when a stock's price has moved too far from its moving average it will retrace its steps and return to close the space. |

|
| Figure 1. Daily chart for BA. |
| Graphic provided by: StockCharts.com. |
| |
| In order to understand why this rule will not always work, let us get down to basics, because sometimes we are so focused on trading we separate ourselves from fundamental concepts. So what exactly is a simple moving average? A simple moving average is just an average of price over the last X number of days. That is all that it is. It does not have any magical properties, it is just, as its name suggests, an average of price. That being the case, why therefore must price act in any particular way when the average itself is simply a function of price? |

|
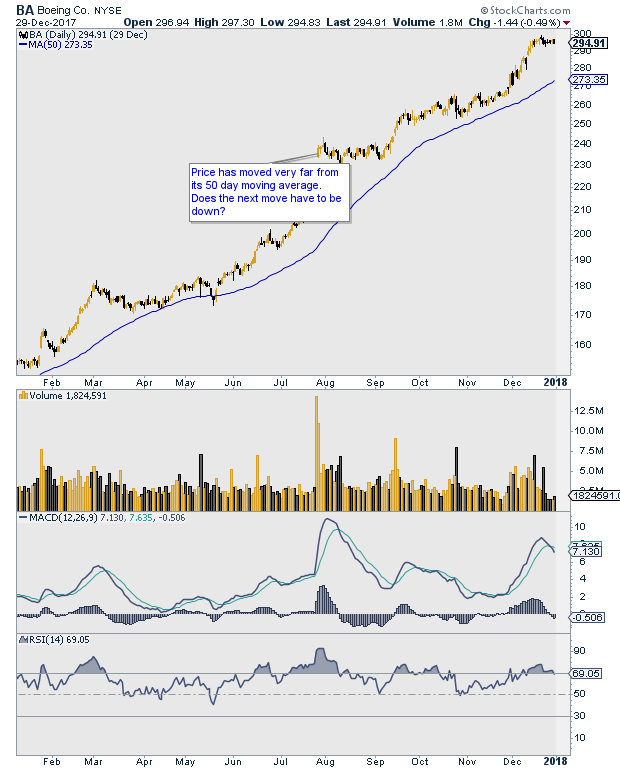
| Figure 2. Daily chart for BA. |
| Graphic provided by: StockCharts.com. |
| |
| Remember that the average we are talking about is a moving target. As the stock's price continues to move higher, so does its average price. Therefore, the idea that because a stock's price has diverted significantly from its SMA its next move must be a reversal to return to the moving average is not necessarily the case. |
| That being said, when price separates from its SMA, it just means current prices are increasing/decreasing faster than earlier prices that the average measures. While we can expect a price rise or decline to eventually slow, we must not expect that slowing to result in a reversal or a reaction. This is where the novice trader sometimes gets tripped up. |
| In the case of BA, the strong bull gapping candles that caused BA to move a significant distance from its SMA was not a signal of weakness, but one of strength. Therefore, in the absence of any signal pointing to weakness, the best trade was not to bet on the future appearance of weakness. Figure 2 shows what happened next. BA absorbed its gains by moving sideways for about six weeks causing the distance between price and the 50-day SMA to narrow. But the stock price did not reverse to the downside. After the pause it resumed its uptrend and continued to make further price highs. Any contrarian bets would have been losing positions. |
Stella Osoba is a trader and financial writer. She is a frequent contributor to "Technical Analysis of Stocks and Commodities" magazine and "Traders.com Advantage" as well as other financial publications.
| E-mail address: | stellaosoba@gmail.com |
Click here for more information about our publications!
Comments
Date: 03/31/18Rank: 3Comment:

Request Information From Our Sponsors
- StockCharts.com, Inc.
- Candle Patterns
- Candlestick Charting Explained
- Intermarket Technical Analysis
- John Murphy on Chart Analysis
- John Murphy's Chart Pattern Recognition
- John Murphy's Market Message
- MurphyExplainsMarketAnalysis-Intermarket Analysis
- MurphyExplainsMarketAnalysis-Visual Analysis
- StockCharts.com
- Technical Analysis of the Financial Markets
- The Visual Investor
- VectorVest, Inc.
- Executive Premier Workshop
- One-Day Options Course
- OptionsPro
- Retirement Income Workshop
- Sure-Fire Trading Systems (VectorVest, Inc.)
- Trading as a Business Workshop
- VectorVest 7 EOD
- VectorVest 7 RealTime/IntraDay
- VectorVest AutoTester
- VectorVest Educational Services
- VectorVest OnLine
- VectorVest Options Analyzer
- VectorVest ProGraphics v6.0
- VectorVest ProTrader 7
- VectorVest RealTime Derby Tool
- VectorVest Simulator
- VectorVest Variator
- VectorVest Watchdog
