HOT TOPICS LIST
- MACD
- Fibonacci
- RSI
- Gann
- ADXR
- Stochastics
- Volume
- Triangles
- Futures
- Cycles
- Volatility
- ZIGZAG
- MESA
- Retracement
- Aroon
INDICATORS LIST
LIST OF TOPICS
PRINT THIS ARTICLE
by Koos van der Merwe
The book Fire and Fury by Michael Wolff has taken over the news. Will it affect the market?
Position: Accumulate
Koos van der Merwe
Has been a technical analyst since 1969, and has worked as a futures and options trader with First Financial Futures in Johannesburg, South Africa.
PRINT THIS ARTICLE
TECHNICAL ANALYSIS
Another Look At The Indexes
01/15/18 05:11:05 PMby Koos van der Merwe
The book Fire and Fury by Michael Wolff has taken over the news. Will it affect the market?
Position: Accumulate
| The market is setting up for a correction. We all know that. The question is what will cause it to happen, and when will it occur? Is the latest gossip about the Presidential administration in the book, Fire and Fury, the trigger? Time will tell. However, one should never forget that President Donald Trump is a businessman, not a politician. His presidential reign is the same way he runs a business, where he is king, and everyone must jump and obey him. The stock market is happy about that as seen by the Dow Jones that broke above 25000 on Friday, January 5. |

|
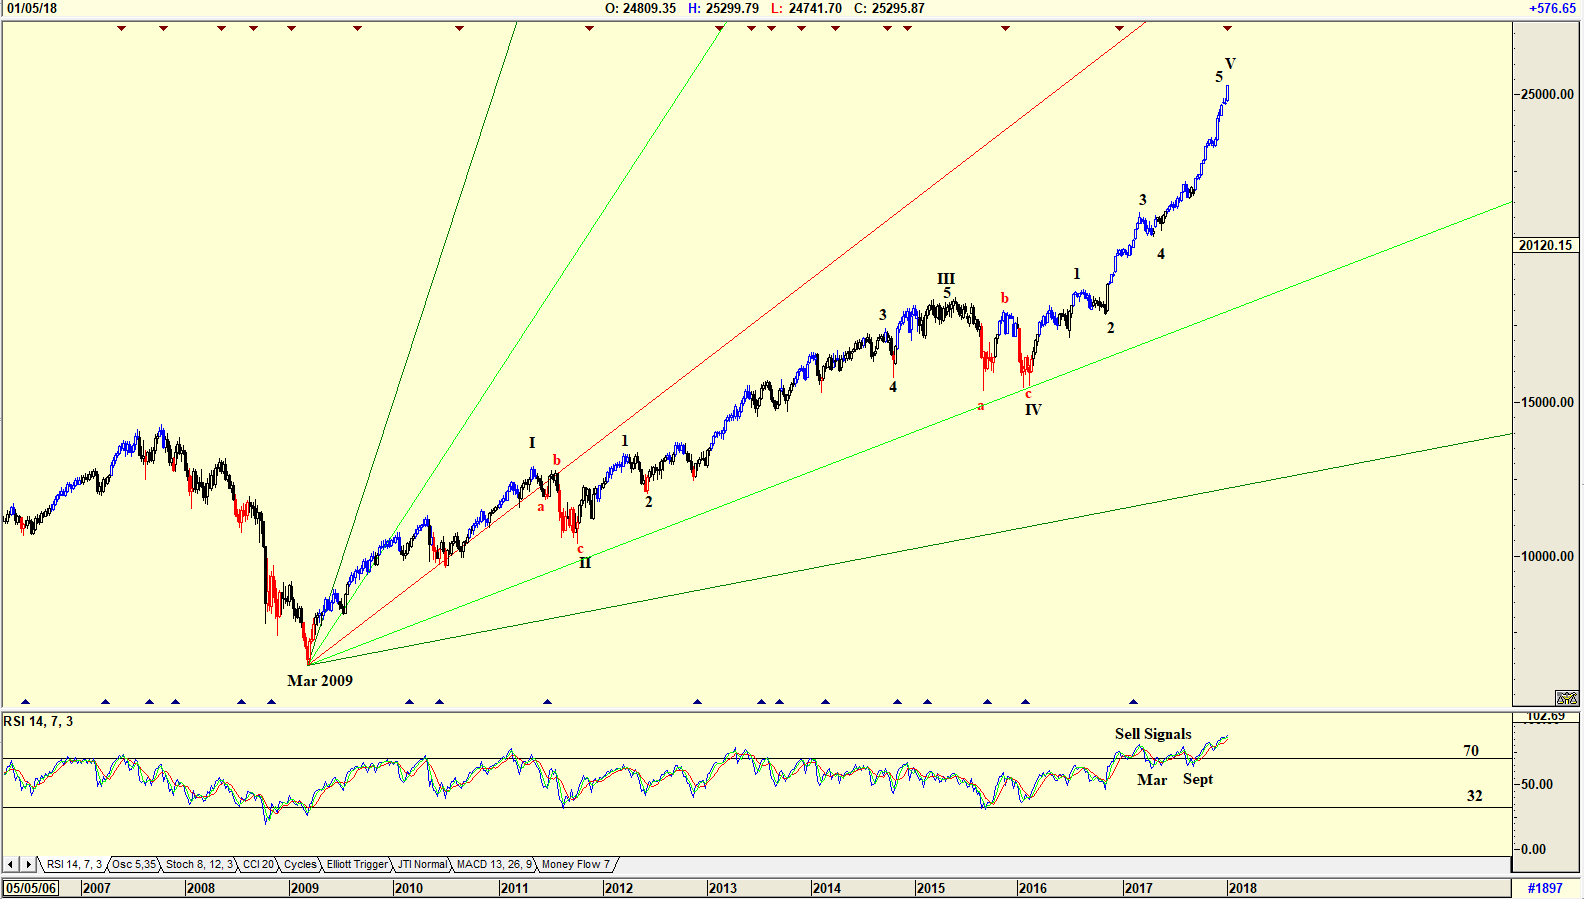
| Figure 1. Weekly chart of DJIA with Elliott wave. |
| Graphic provided by: AdvancedGET. |
| |
| The chart in Figure 1 is a weekly chart of the Dow Jones showing how the Dow rose strongly from January 2017 when Donald Trump became President, to 25324.40 on Friday, January 5. The RSI Index reached overbought levels and started to suggest a sell in December 2016, and gave another sell in March 2017 then reversed its trend, probably as President Trump's business strategies started to bear fruit. |

|
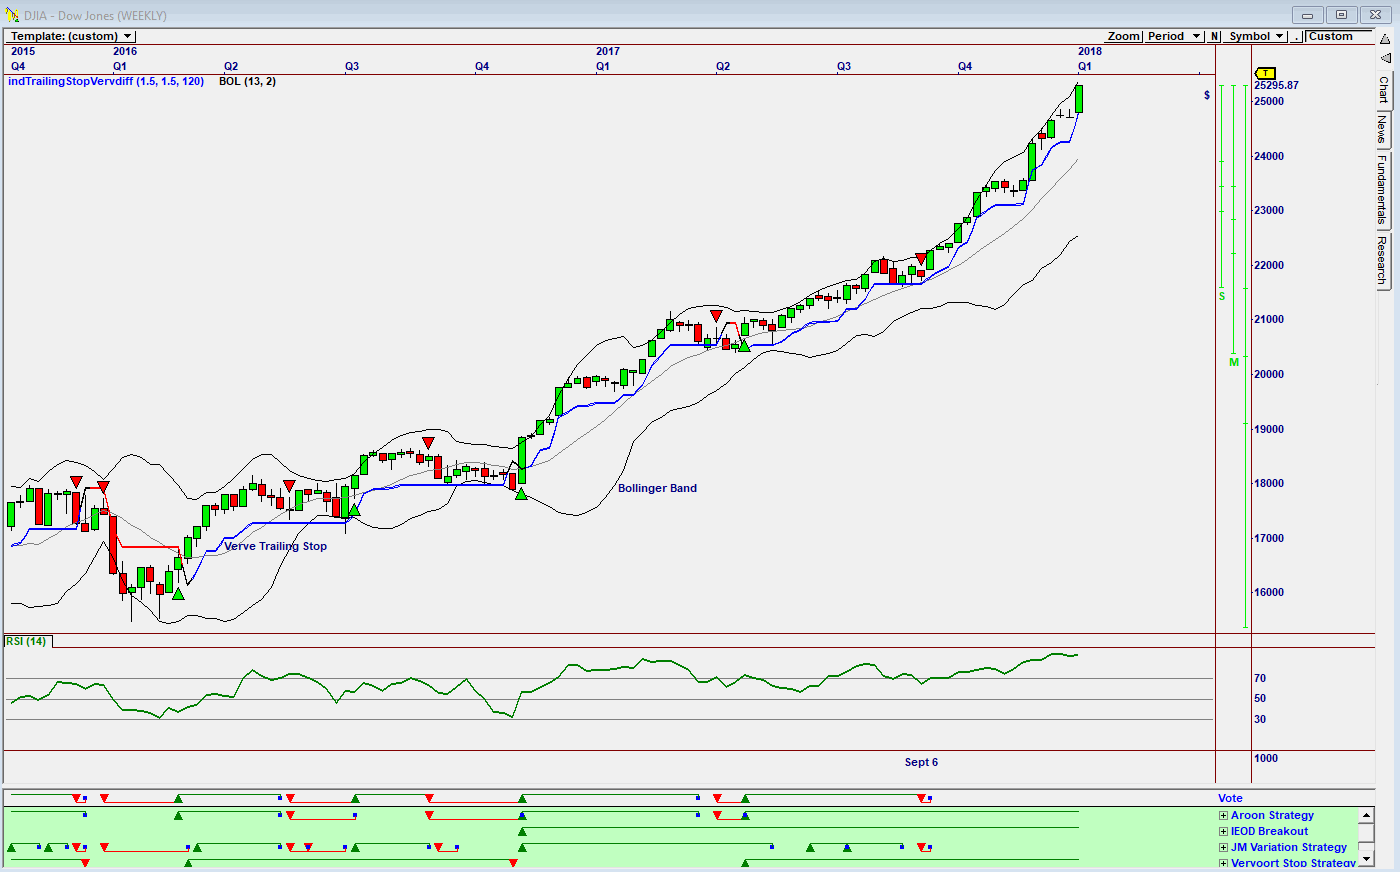
| Figure 2. Omnitrader chart of DJIA. |
| Graphic provided by: Omnitrader. |
| |
| The chart in Figure 2 is a weekly Omnitrader chart showing that a sell signal was given on September 6, based on the JM Variation Strategy and then quickly cancelled because the Aroon Strategy, the IEOD strategy and the Vervoort Stop strategy were all showing buys. |

|
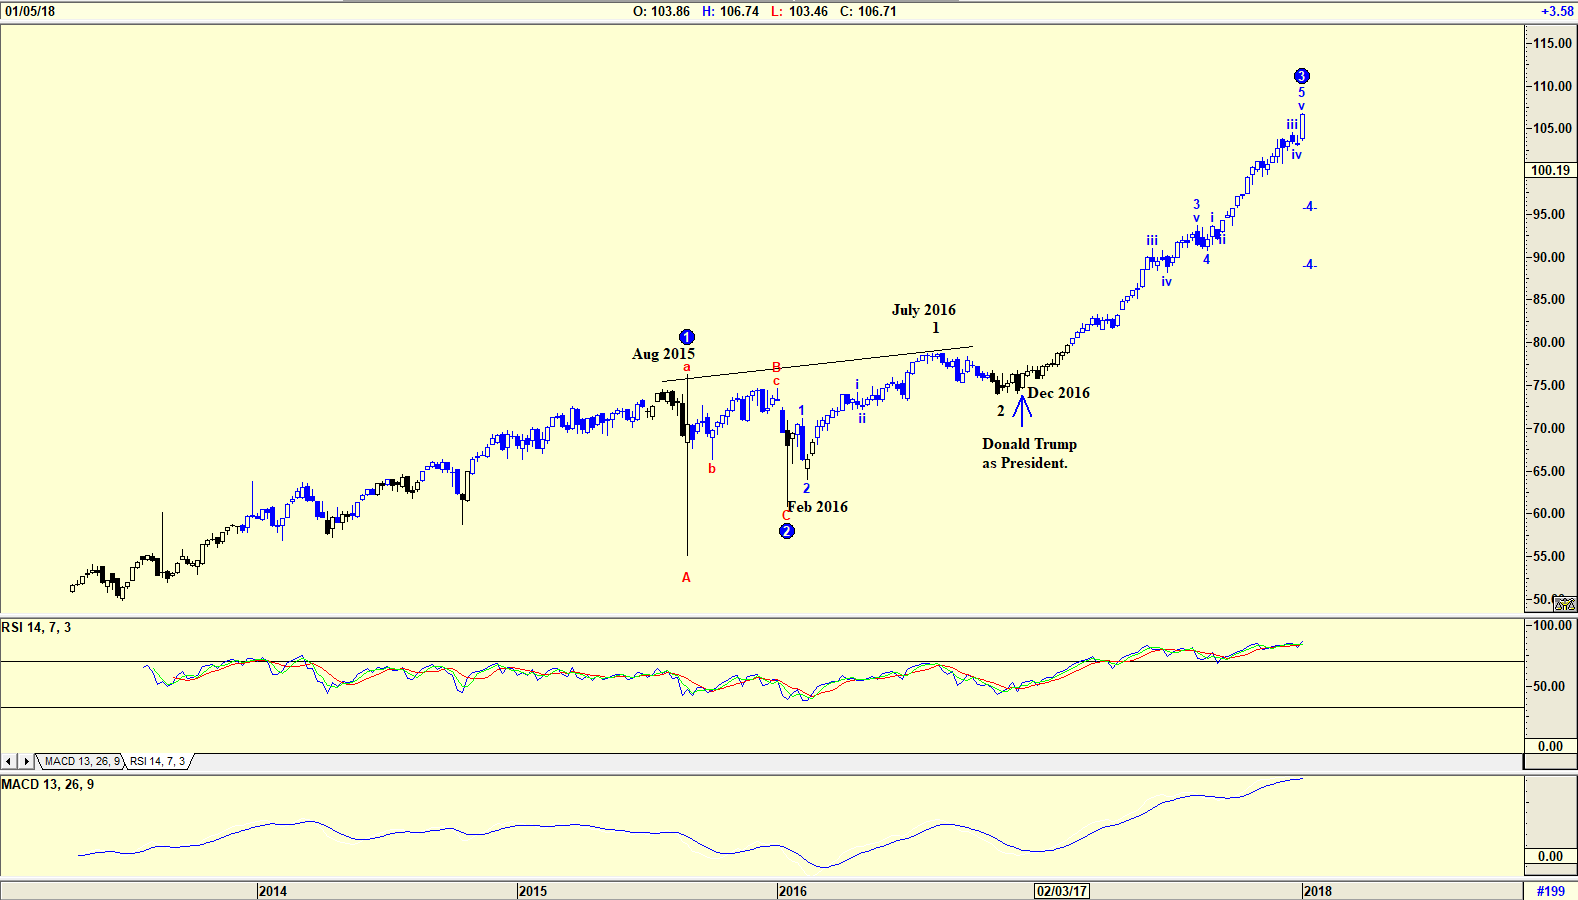
| Figure 3. Weekly chart of Powershares DWA Momentum Portfolio. |
| Graphic provided by: AdvancedGET. |
| |
| A look at the Powershares DWA Momentum Portfolio (PDP) in Figure 2 has an Elliott wave count suggesting that the ETF is in a WAVE 3 and could fall in a WAVE 4 correction. Do note how the ETF fell in a wave 2 correction on January 1, 2016, and how the index started rising strongly in December 2016 when it was announced that Donald Trump had won the Presidential election. The chart is suggesting that a WAVE 4 correction could occur, but one should not forget that a WAVE 4 correction is a great deal milder than a WAVE 5 correction. |

|
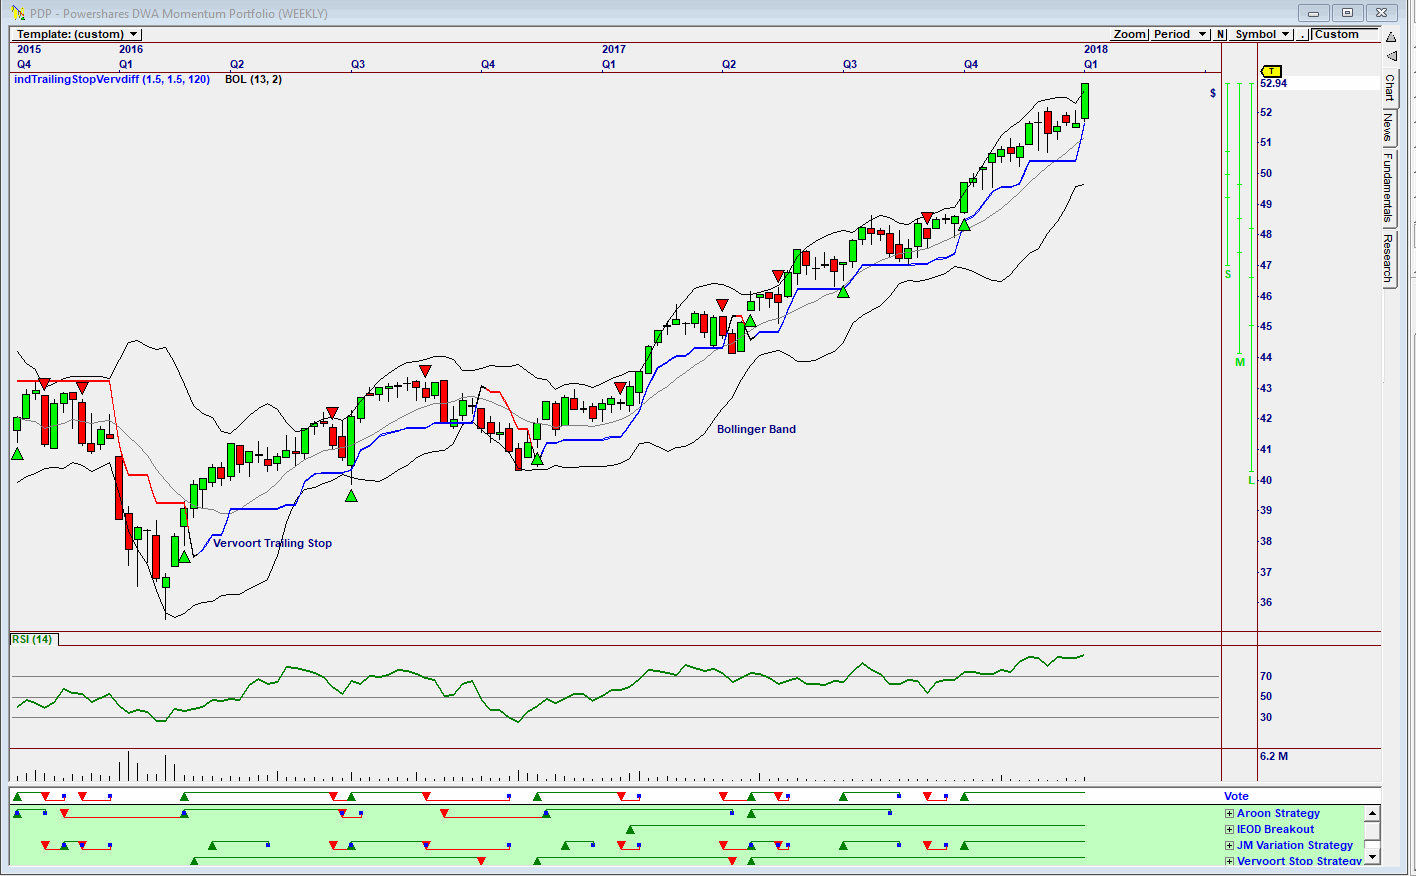
| Figure 4. Omnitrader chart of the Powershares DWA Momentum Portfolio. |
| Graphic provided by: Omnitrader. |
| |
| Looking at a weekly Omnitrader chart of the Powershares DWA Momentum Portolio, the Vote line is suggesting that the chart is in a buy mode based a buy signals given by the IEOD Breakout, the JM Variation and the Vervoort Stop Strategies. Yes, the market is making new highs, probably triggered by the Tax bill that passed through Congress in December 2017, a bill that benefits businesses, stimulating the American economy. However, an "up, up and away" tends to reverse at sometime or other. The only uncertainty is when will it start happening? Caution prevails. |
Has been a technical analyst since 1969, and has worked as a futures and options trader with First Financial Futures in Johannesburg, South Africa.
| Address: | 3256 West 24th Ave |
| Vancouver, BC | |
| Phone # for sales: | 6042634214 |
| E-mail address: | petroosp@gmail.com |
Click here for more information about our publications!
PRINT THIS ARTICLE

Request Information From Our Sponsors
- StockCharts.com, Inc.
- Candle Patterns
- Candlestick Charting Explained
- Intermarket Technical Analysis
- John Murphy on Chart Analysis
- John Murphy's Chart Pattern Recognition
- John Murphy's Market Message
- MurphyExplainsMarketAnalysis-Intermarket Analysis
- MurphyExplainsMarketAnalysis-Visual Analysis
- StockCharts.com
- Technical Analysis of the Financial Markets
- The Visual Investor
- VectorVest, Inc.
- Executive Premier Workshop
- One-Day Options Course
- OptionsPro
- Retirement Income Workshop
- Sure-Fire Trading Systems (VectorVest, Inc.)
- Trading as a Business Workshop
- VectorVest 7 EOD
- VectorVest 7 RealTime/IntraDay
- VectorVest AutoTester
- VectorVest Educational Services
- VectorVest OnLine
- VectorVest Options Analyzer
- VectorVest ProGraphics v6.0
- VectorVest ProTrader 7
- VectorVest RealTime Derby Tool
- VectorVest Simulator
- VectorVest Variator
- VectorVest Watchdog
