HOT TOPICS LIST
- MACD
- Fibonacci
- RSI
- Gann
- ADXR
- Stochastics
- Volume
- Triangles
- Futures
- Cycles
- Volatility
- ZIGZAG
- MESA
- Retracement
- Aroon
INDICATORS LIST
LIST OF TOPICS
PRINT THIS ARTICLE
by Koos van der Merwe
President Donald Trump has served his first year in office. What does the year ahead hold for him?
Position: Hold
Koos van der Merwe
Has been a technical analyst since 1969, and has worked as a futures and options trader with First Financial Futures in Johannesburg, South Africa.
PRINT THIS ARTICLE
CYCLES
A Look At The Presidential Cycle
01/04/18 04:34:24 PMby Koos van der Merwe
President Donald Trump has served his first year in office. What does the year ahead hold for him?
Position: Hold
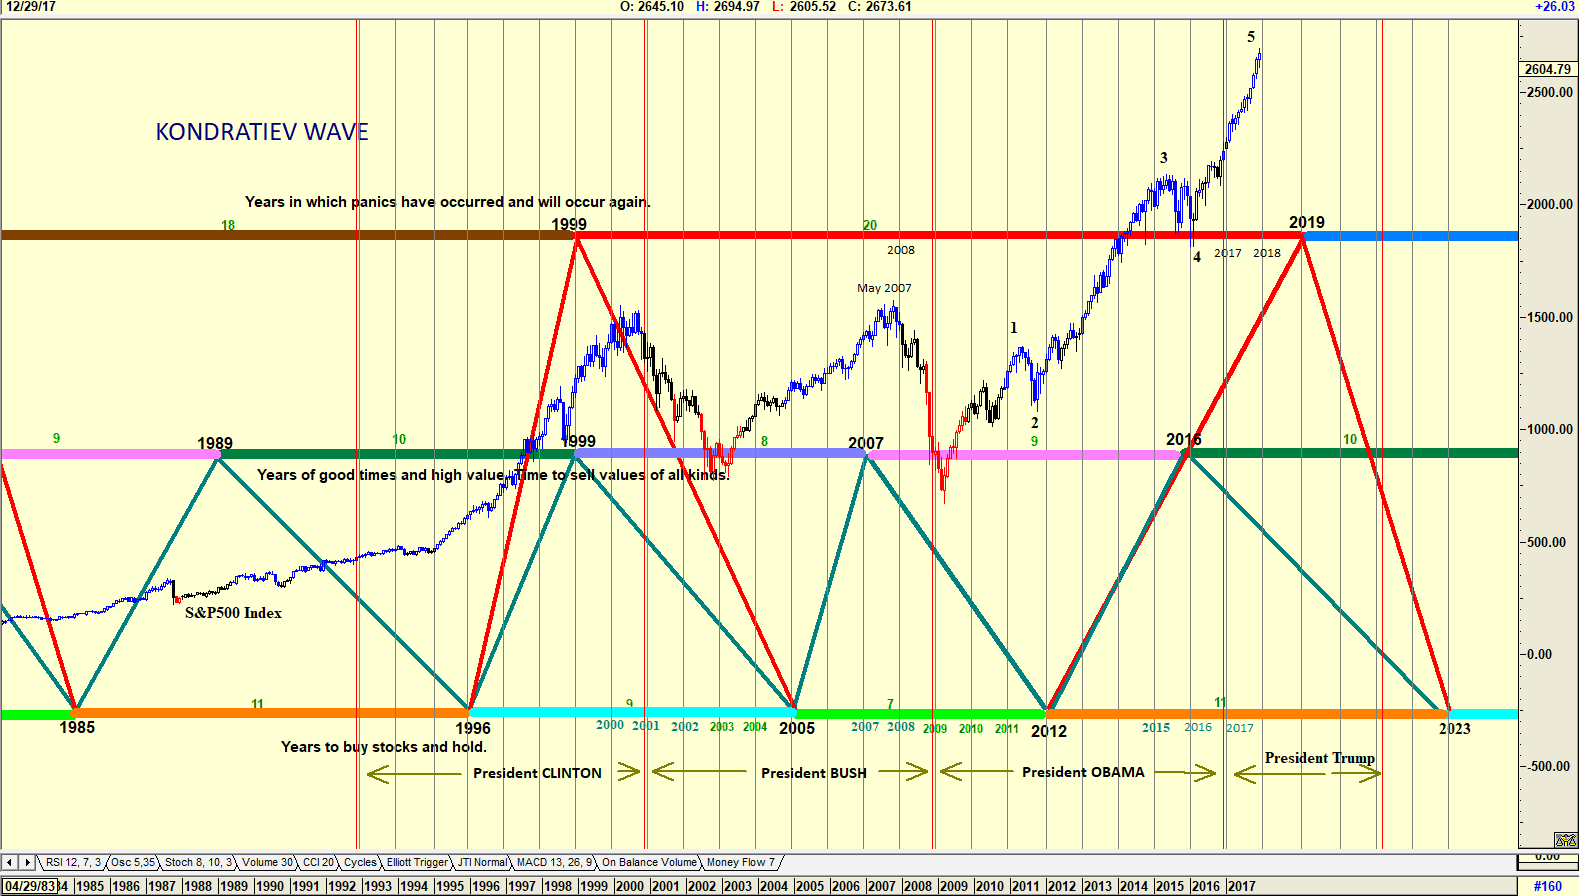
| The Kondratiev Wave was developed by an economist who laid down his life in Communist Russia defending his economic beliefs. In his book, "The Major Economic Cycles", that was published in 1925, he wrote policies that were in stark contrast to that of Stalin. Because of this he was arrested in 1930 and executed in 1938. Investopedia defines the K-Wave as it is known today, as "A long-term cycle present in capitalist economies that represents long-term, high-growth economic periods." Over the last 200 years, the K-Waves have stood the test of time and have correctly identified various periods of important economic activity. Very few cycles in history have been as accurate as the K-Wave. |

|
| Figure 1. The K-Wave with the Presidential cycle. |
| Graphic provided by: AdvancedGET. |
| |
| Looking at the chart in Figure 1, one can see the K-Wave with the Presidential cycle of three previous Presidents included. With President Clinton the market corrected one year after the K-Wave suggested a correction in 1999. With President Bush, the correction started in May 2007, 5 months after the K-Wave suggested a correction. With President Obama, a minor correction that suggested an Elliott 4th wave in the S&P 500 index, occurred one year before the K-Wave correction, and started to rise as the year 2016 started, a year before the election of President Trump. With the S&P500 rising strongly with the election of President Trump, and the K-Wave now one year ahead of 2019, is the K-Wave suggesting a major correction in the year ahead? |

|
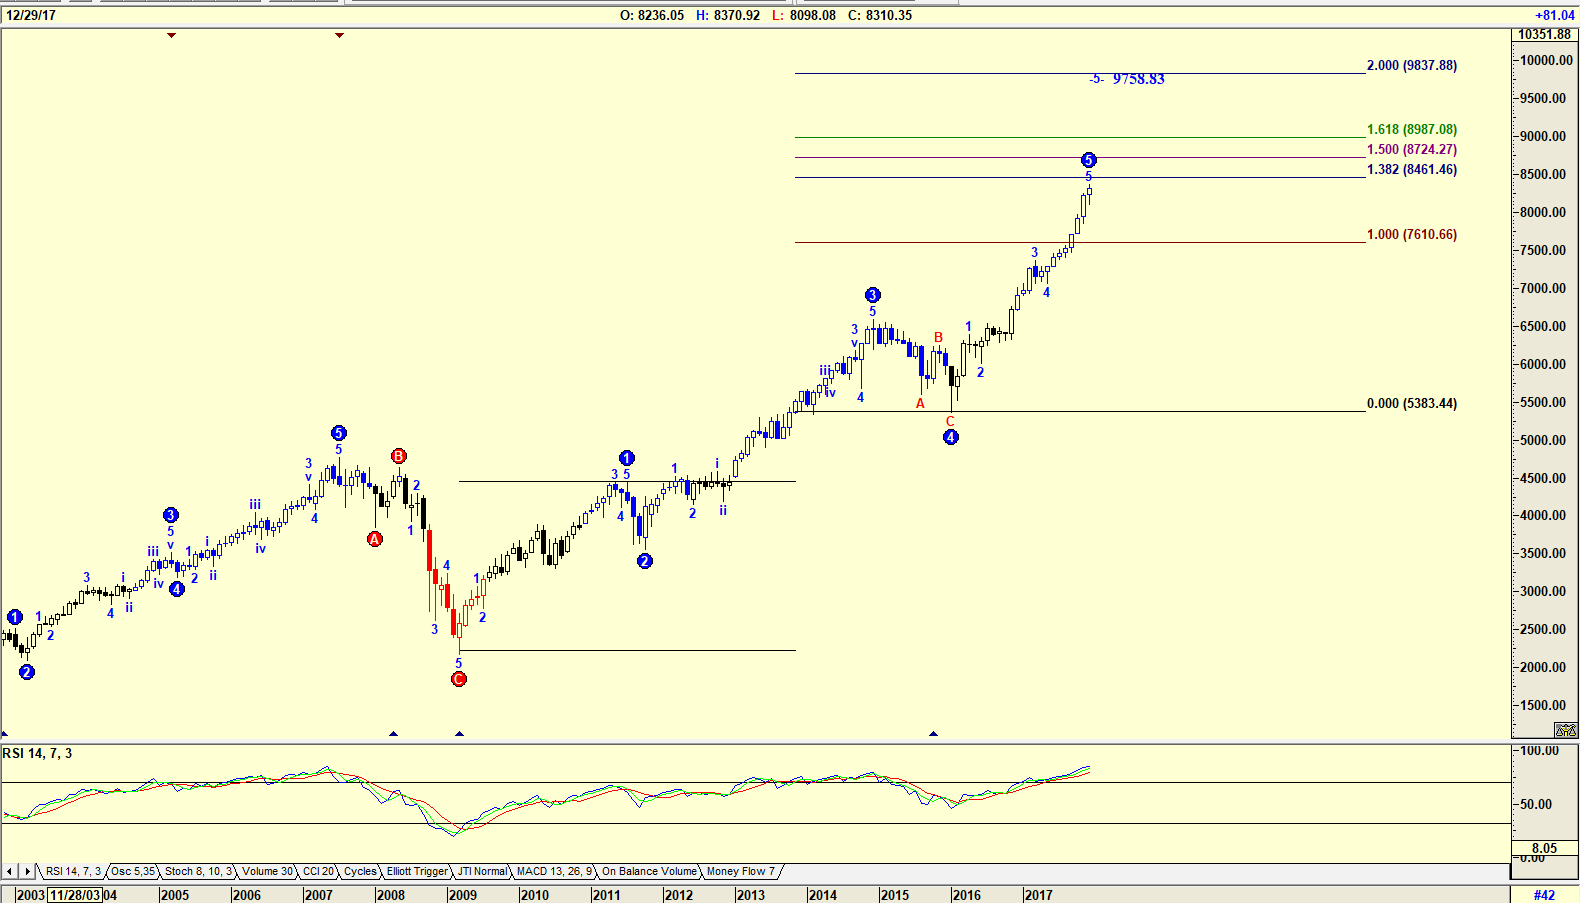
| Figure 2. The Nasdaq Index with an Elliott wave count. |
| Graphic provided by: AdvancedGET. |
| |
| The chart in Figure 2 is a monthly chart of the Nasdaq Composite Index with an Elliott wave count suggesting that the index is in a WAVE 5 that could still rise to 9758.83. What is against the Elliott wave principal is that at present WAVE 5 is greater than WAVE 1. This is suggesting over enthusiasm by buyers and that a correction could occur at any time. The RSI-14 index is at overbought levels, but is not suggesting a sell. |
| Many investors in the market are looking for a correction during the year 2018. Whether this will occur depends on the principals of President Donald Trump. Although his rating at 35 is currently the lowest rating of any previous President, one should not forget that he is a businessman first and a politician second. He looks for a profit first, and throws his hat at politics. However, the K-Wave is suggesting that a correction is on the cards. When that correction will occur is anyones guess. |
Has been a technical analyst since 1969, and has worked as a futures and options trader with First Financial Futures in Johannesburg, South Africa.
| Address: | 3256 West 24th Ave |
| Vancouver, BC | |
| Phone # for sales: | 6042634214 |
| E-mail address: | petroosp@gmail.com |
Click here for more information about our publications!
PRINT THIS ARTICLE

Request Information From Our Sponsors
- StockCharts.com, Inc.
- Candle Patterns
- Candlestick Charting Explained
- Intermarket Technical Analysis
- John Murphy on Chart Analysis
- John Murphy's Chart Pattern Recognition
- John Murphy's Market Message
- MurphyExplainsMarketAnalysis-Intermarket Analysis
- MurphyExplainsMarketAnalysis-Visual Analysis
- StockCharts.com
- Technical Analysis of the Financial Markets
- The Visual Investor
- VectorVest, Inc.
- Executive Premier Workshop
- One-Day Options Course
- OptionsPro
- Retirement Income Workshop
- Sure-Fire Trading Systems (VectorVest, Inc.)
- Trading as a Business Workshop
- VectorVest 7 EOD
- VectorVest 7 RealTime/IntraDay
- VectorVest AutoTester
- VectorVest Educational Services
- VectorVest OnLine
- VectorVest Options Analyzer
- VectorVest ProGraphics v6.0
- VectorVest ProTrader 7
- VectorVest RealTime Derby Tool
- VectorVest Simulator
- VectorVest Variator
- VectorVest Watchdog
