HOT TOPICS LIST
- MACD
- Fibonacci
- RSI
- Gann
- ADXR
- Stochastics
- Volume
- Triangles
- Futures
- Cycles
- Volatility
- ZIGZAG
- MESA
- Retracement
- Aroon
INDICATORS LIST
LIST OF TOPICS
PRINT THIS ARTICLE
by Stella Osoba, CMT
For many intermediate-term traders, the daily charts often provide sufficient information for trades. But there are times when the additional information provided by weekly charts can be invaluable.
Position: N/A
Stella Osoba, CMT
Stella Osoba is a trader and financial writer. She is a frequent contributor to "Technical Analysis of Stocks and Commodities" magazine and "Traders.com Advantage" as well as other financial publications.
PRINT THIS ARTICLE
TRIANGLES
When A Step Back Is Revealing
01/05/18 04:24:54 PMby Stella Osoba, CMT
For many intermediate-term traders, the daily charts often provide sufficient information for trades. But there are times when the additional information provided by weekly charts can be invaluable.
Position: N/A
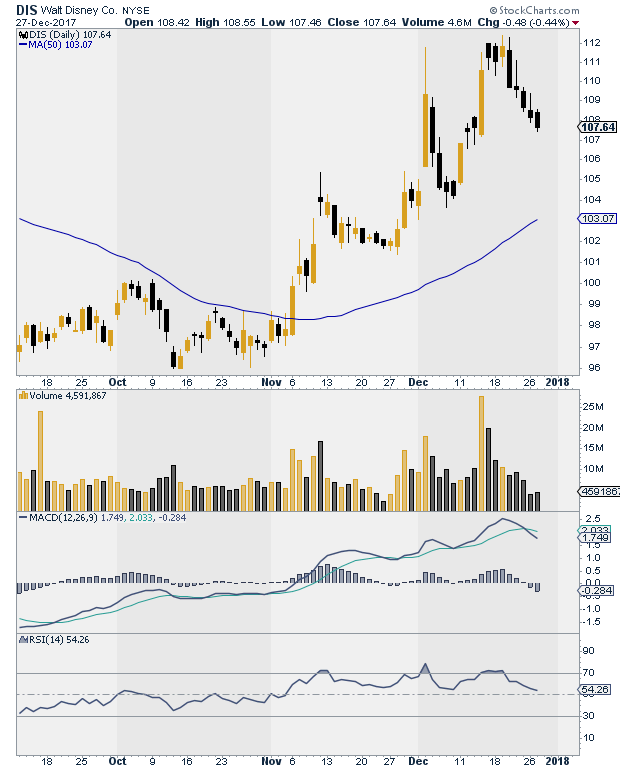
| The daily chart of Walt Disney (DIS) (Figure 1) shows that on November 7, 2017, it broke out of a base. If you had caught it then you could have traded the ensuing uptrend. The stock rose from a low of 99.94 on that day to a high of 112.39 on December 19, 2017. It is currently reacting, and this reaction could be nothing more than a healthy one in the continuing uptrend. This could be especially true because ever since the stock broke above its 50-day moving average it has formed a series of higher highs and higher lows. The moving average is slanting upwards and both the MACD and RSI are above their center lines — all bullish signals. |

|
| Figure 1. Daily chart for DIS. |
| Graphic provided by: StockCharts.com. |
| |
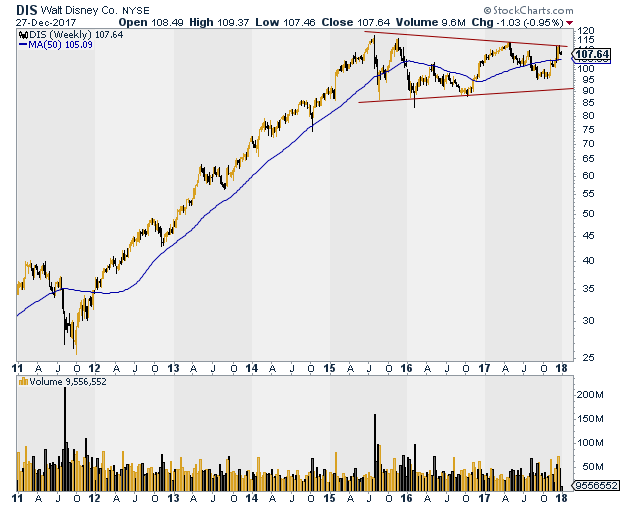
| But if you take a look at the longer term (weekly) chart of DIS (Figure 2), quite another picture emerges. While it is true that DIS is in an uptrend, it is short term, the longer term chart shows the up move is part of a long sideways trend or a triangle. In August 2015, DIS reached a high of 117.68. In November 2015, it tested that high and failed to break through, reaching a lower high of 116.30. The next test of that high was in May 2017, at which point the stock could only manage a high of 113.84. The high of 112.39 reached in December 2017 is typical of a symmetrical triangle as price forms lower highs and higher lows, thereby converging. Each time DIS has tried to test the previous high in its trading range it has fallen short and been overcome by selling pressure. Viewed from this perspective, the daily chart is not as bullish as it might at first seem. DIS is in a holding pattern, locked in a battle between buyers and sellers with neither side able to dominate for long. |

|
| Figure 2. Weekly chart for DIS. |
| Graphic provided by: StockCharts.com. |
| |
| With technical analysis, probabilities are the name of the game. We cannot be certain that after the current reaction is over DIS will resume its current short term uptrend and break out of its longer term trading range. If it does, this will be an important move as the range has lasted for about two and a half years, which is a significant amount of time. Like base building at bottoms, the longer amount of time a stock stays in a range bound pattern, the more significant the breakout will be up or down when it happens. Therefore, it is worth waiting and watching to see what the stock will do if it resumes its up trend and approaches resistance. At this stage the next move out of the reaction could be nothing more than a continuation of the trading range with resistance in the 114 to 118 vicinity. But a break above the high of the resistance level could be the start of a major move up. Symmetrical triangles are often continuation patterns, but a good percentage of them are reversals. |
| As usual, this piece is educational only. |
Stella Osoba is a trader and financial writer. She is a frequent contributor to "Technical Analysis of Stocks and Commodities" magazine and "Traders.com Advantage" as well as other financial publications.
| E-mail address: | stellaosoba@gmail.com |
Click here for more information about our publications!
Comments
Date: 01/16/18Rank: 4Comment:

|

Request Information From Our Sponsors
- StockCharts.com, Inc.
- Candle Patterns
- Candlestick Charting Explained
- Intermarket Technical Analysis
- John Murphy on Chart Analysis
- John Murphy's Chart Pattern Recognition
- John Murphy's Market Message
- MurphyExplainsMarketAnalysis-Intermarket Analysis
- MurphyExplainsMarketAnalysis-Visual Analysis
- StockCharts.com
- Technical Analysis of the Financial Markets
- The Visual Investor
- VectorVest, Inc.
- Executive Premier Workshop
- One-Day Options Course
- OptionsPro
- Retirement Income Workshop
- Sure-Fire Trading Systems (VectorVest, Inc.)
- Trading as a Business Workshop
- VectorVest 7 EOD
- VectorVest 7 RealTime/IntraDay
- VectorVest AutoTester
- VectorVest Educational Services
- VectorVest OnLine
- VectorVest Options Analyzer
- VectorVest ProGraphics v6.0
- VectorVest ProTrader 7
- VectorVest RealTime Derby Tool
- VectorVest Simulator
- VectorVest Variator
- VectorVest Watchdog
