HOT TOPICS LIST
- MACD
- Fibonacci
- RSI
- Gann
- ADXR
- Stochastics
- Volume
- Triangles
- Futures
- Cycles
- Volatility
- ZIGZAG
- MESA
- Retracement
- Aroon
INDICATORS LIST
LIST OF TOPICS
PRINT THIS ARTICLE
by Koos van der Merwe
We day trade options on SPY. One outstanding stock, one simple strategy, one hour a day to earn 5-10%.
Position: Accumulate
Koos van der Merwe
Has been a technical analyst since 1969, and has worked as a futures and options trader with First Financial Futures in Johannesburg, South Africa.
PRINT THIS ARTICLE
ELLIOTT WAVE
Playing With The ETF Spiders
12/27/17 04:26:02 PMby Koos van der Merwe
We day trade options on SPY. One outstanding stock, one simple strategy, one hour a day to earn 5-10%.
Position: Accumulate
| "I got out of equity trading years ago when I experienced uncalled for losses... totally befuddles the mind as to how things play out, absolutely defies even gravity. So now I only trade SPY, which makes life so much easier." The above is an email I received from a reader of STOCKS & COMMODITES. I must say that I have never looked at the ETF Spiders as something to trade, but since it has been brought to my attention, I must admit it does make a great deal of sense, especially in a market that is going up, up and up with no top in sight. We all know that a crash is due, even Warren Buffett is suggesting that it is on the cards; the only problem that not even Gann charts can solve, is when? |

|
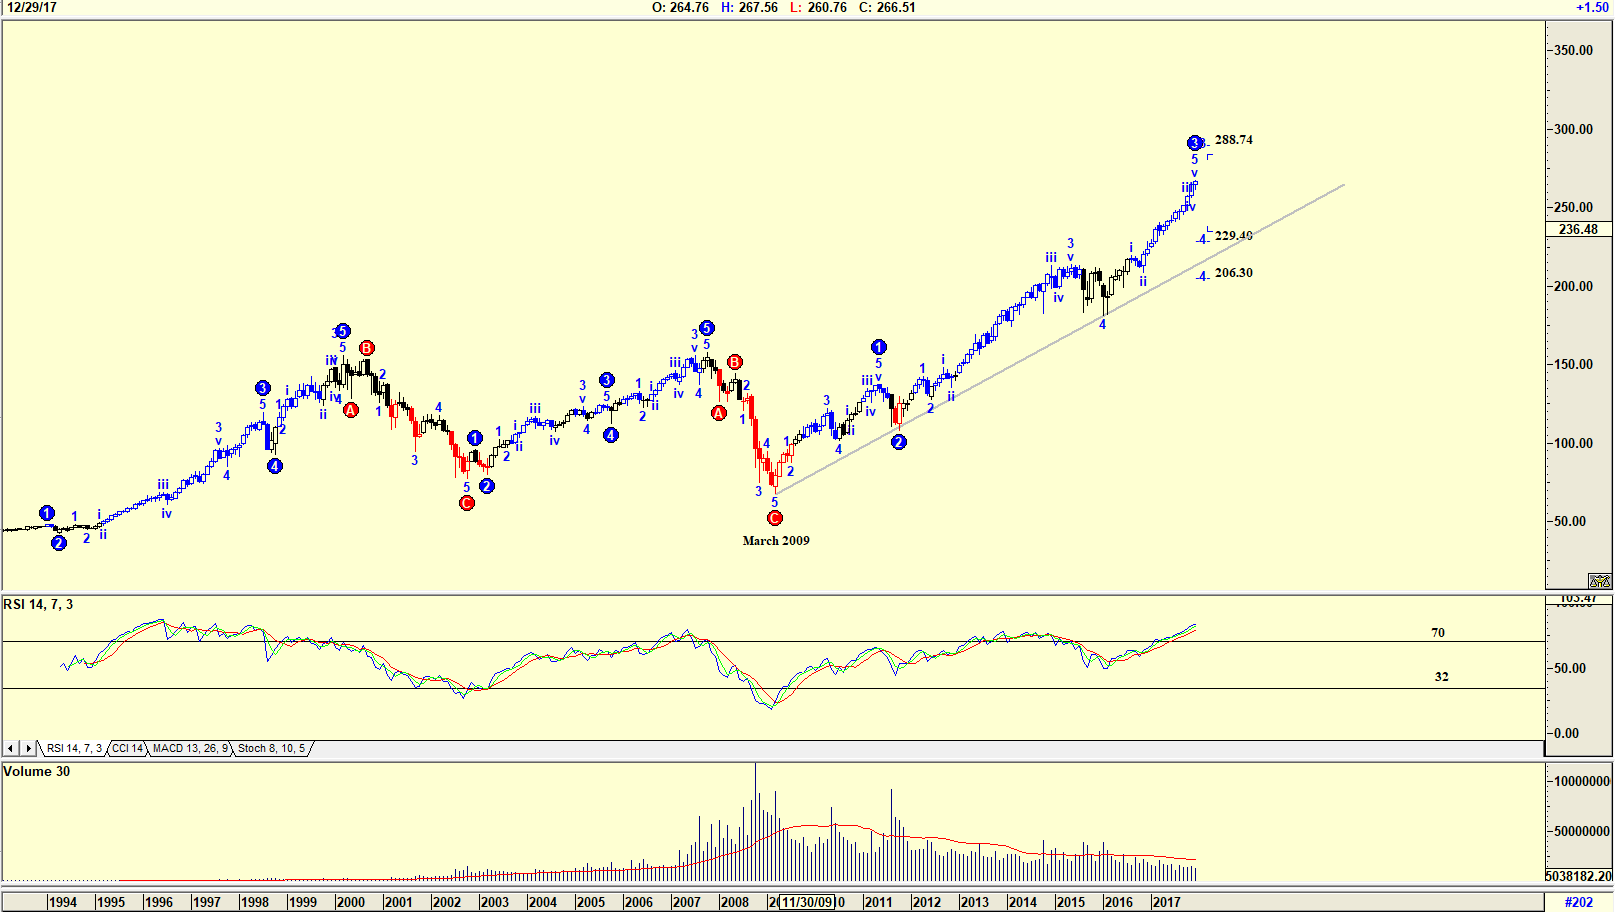
| Figure 1. A monthly chart of SPY. |
| Graphic provided by: AdvancedGET. |
| |
| The chart in Figure 1 is a monthly chart with an Elliott wave count suggesting that the SPY is in a WAVE 3 and that it could correct in a WAVE 4 to either 229.40 or 206.30. The SPY has moved up strongly from March 2009 and with the RSI Indicator at overbought levels but not giving a sell signal, it could still rise further to possibly 288.74, a WAVE 3 top possibility. Do note that volume is falling. A rising share price with falling volume does suggest weakness. |

|
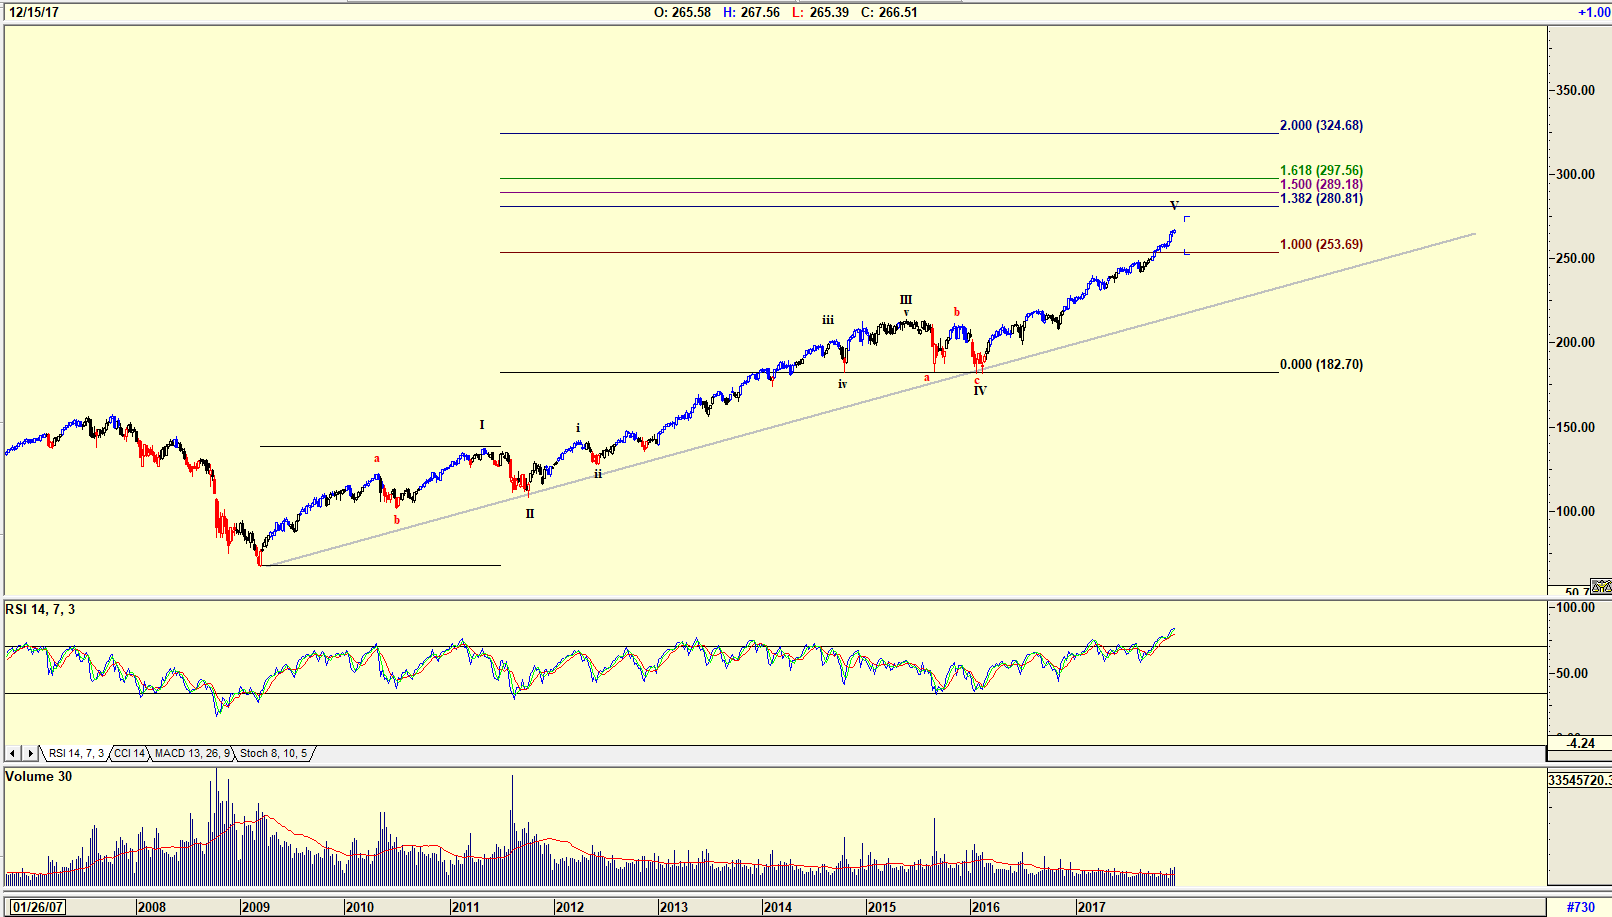
| Figure 2. A weekly chart of SPY. |
| Graphic provided by: AdvancedGET. |
| |
| The chart in Figure 2 is a weekly chart with an Elliott wave count suggesting that the SPY could be in a WAVE 5. The RSI indicator is at overbought levels but has not given a sell signal, suggesting it could rise further. A Fibonacci extension of WAVE 1 added to the low of WAVE IV suggests a WAVE V top of either 280.81, 289.18, or 297.56. It could even rise to a high of 324.68. Elliott wave has a WAVE 5 equal to a WAVE 1, and it is very rare that a WAVE 5 is greater than a WAVE 1. Political events are obviously showing their influence. |

|
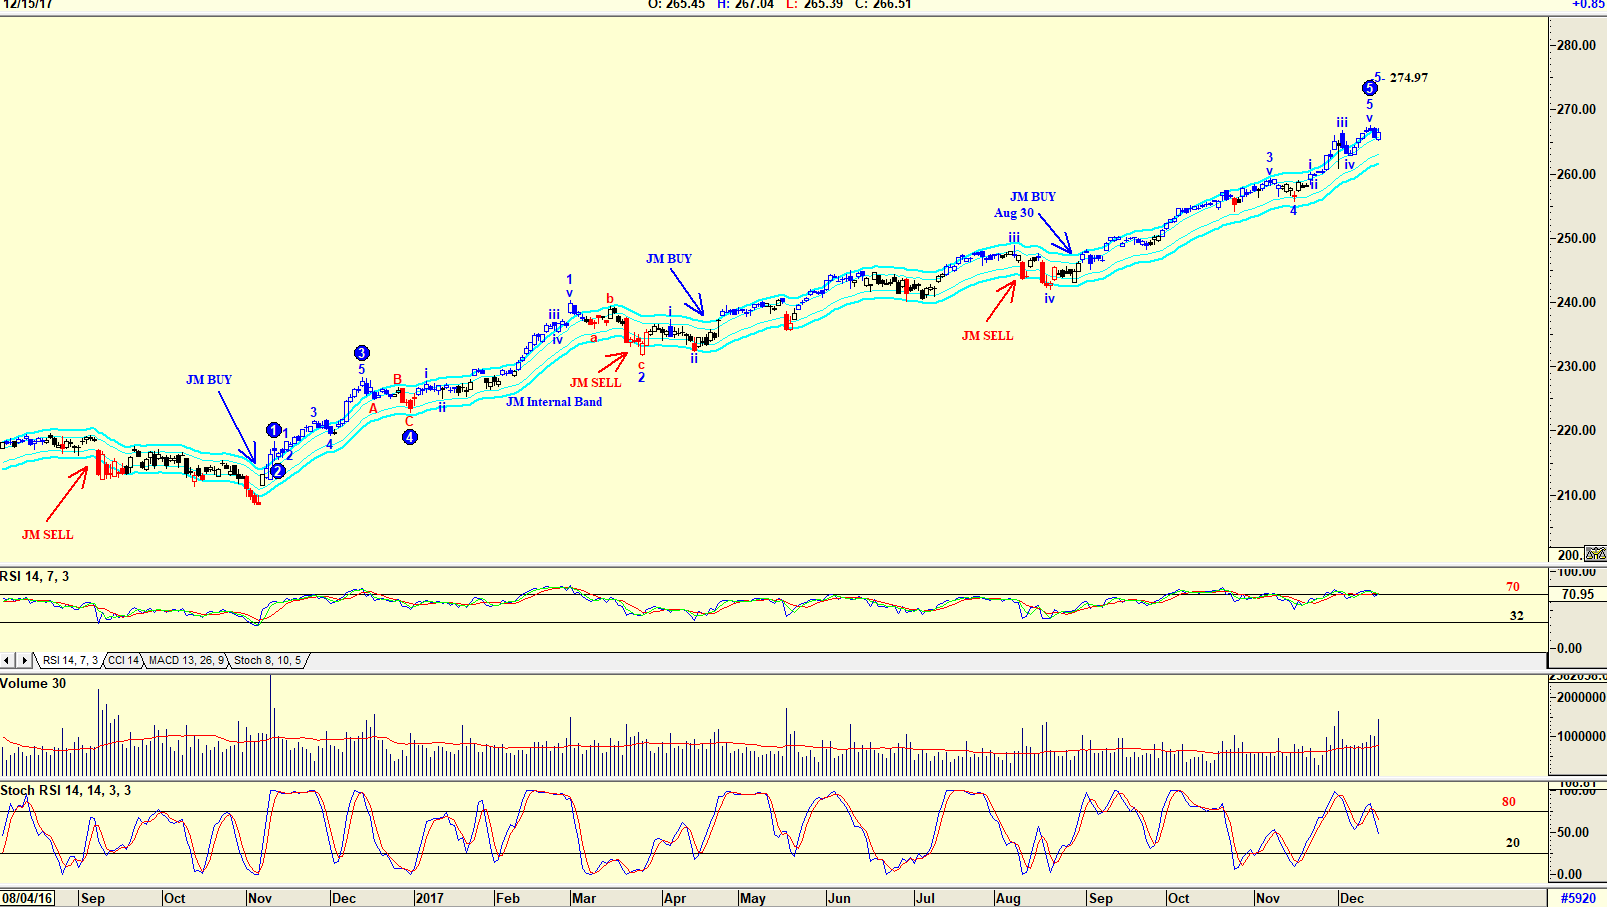
| Figure 3 A Daily chart of SPY. |
| Graphic provided by: AdvancedGET. |
| |
| The chart in Figure 3 is a daily chart with an Elliott wave count suggesting that SPY is in a WAVE 5 with the possibility that the price could rise to 274.97. Do note that the RSI indicator is playing with the 70 horizontal line, but has not confirmed a sell signal, but the Stochastic RSI indicator has given a sell signal. Volume rose as the share price strengthened. The JM Internal Band gave a buy on August 30. The JM Internal Band is a 15 period simple moving average offset by 2% positive and 2% negative. A move above the upper band suggests a buy and below the lower band a sell. Whether you trade the Spiders ETF by buying and selling the ETF, or by trading the ETF buy selling naked weekly put options and if assigned, then selling weekly covered calls, the index does remove a great deal of stress — like declaring dividends, etc. Definitely something to look at. |
Has been a technical analyst since 1969, and has worked as a futures and options trader with First Financial Futures in Johannesburg, South Africa.
| Address: | 3256 West 24th Ave |
| Vancouver, BC | |
| Phone # for sales: | 6042634214 |
| E-mail address: | petroosp@gmail.com |
Click here for more information about our publications!
PRINT THIS ARTICLE

Request Information From Our Sponsors
- VectorVest, Inc.
- Executive Premier Workshop
- One-Day Options Course
- OptionsPro
- Retirement Income Workshop
- Sure-Fire Trading Systems (VectorVest, Inc.)
- Trading as a Business Workshop
- VectorVest 7 EOD
- VectorVest 7 RealTime/IntraDay
- VectorVest AutoTester
- VectorVest Educational Services
- VectorVest OnLine
- VectorVest Options Analyzer
- VectorVest ProGraphics v6.0
- VectorVest ProTrader 7
- VectorVest RealTime Derby Tool
- VectorVest Simulator
- VectorVest Variator
- VectorVest Watchdog
- StockCharts.com, Inc.
- Candle Patterns
- Candlestick Charting Explained
- Intermarket Technical Analysis
- John Murphy on Chart Analysis
- John Murphy's Chart Pattern Recognition
- John Murphy's Market Message
- MurphyExplainsMarketAnalysis-Intermarket Analysis
- MurphyExplainsMarketAnalysis-Visual Analysis
- StockCharts.com
- Technical Analysis of the Financial Markets
- The Visual Investor
