

HOT TOPICS LIST
- MACD
- Fibonacci
- RSI
- Gann
- ADXR
- Stochastics
- Volume
- Triangles
- Futures
- Cycles
- Volatility
- ZIGZAG
- MESA
- Retracement
- Aroon
INDICATORS LIST
LIST OF TOPICS
PRINT THIS ARTICLE
by Koos van der Merwe
Can FANG stocks tell us where the market is going? Let us have a look.
Position: Sell
Koos van der Merwe
Has been a technical analyst since 1969, and has worked as a futures and options trader with First Financial Futures in Johannesburg, South Africa.
PRINT THIS ARTICLE
ELLIOTT WAVE
Another Look At FANG
12/21/17 04:17:31 PMby Koos van der Merwe
Can FANG stocks tell us where the market is going? Let us have a look.
Position: Sell
| FANG is an acronym created by TheStreet's Jim Cramer a few years ago. The name represents four of the most popular and best performing tech stocks listed. The stocks are Facebook, Amazon, Netflix and Google. FANG stocks could tell us where the market is going, and with Bitcoin capturing everyone's attention; with experts suggesting that a bubble has formed, waiting to explode, looking at FANG stocks may tell us how the market may be affected if and when that Bitcoin bubble does burst. |
|
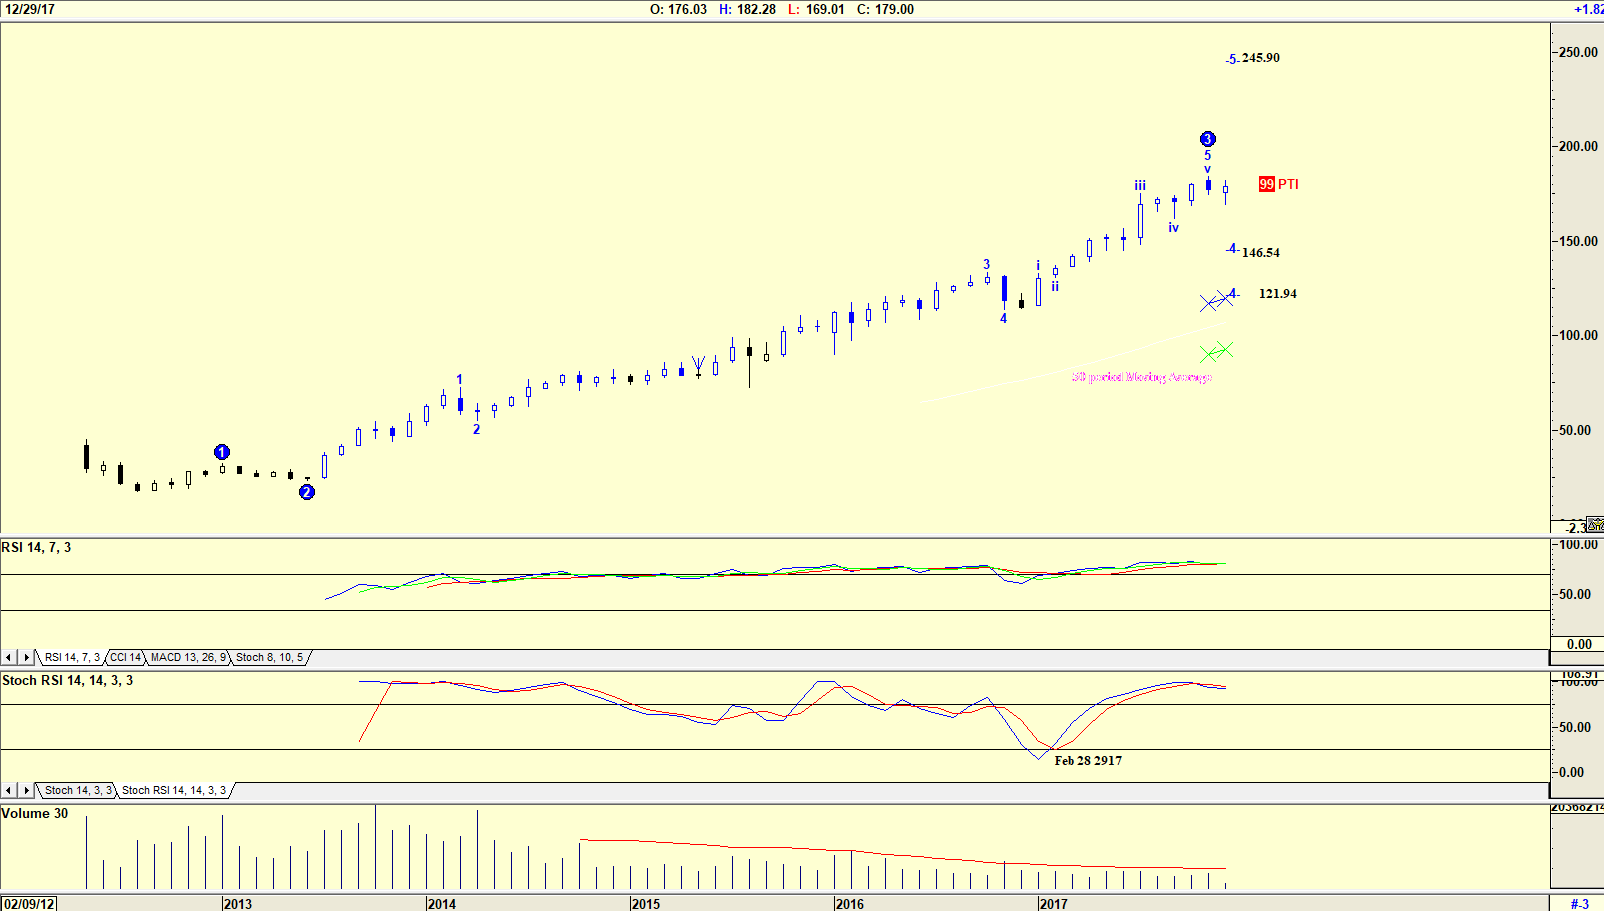
| Figure 1. Monthly chart of Facebook. |
| Graphic provided by: AdvancedGET. |
| |
| The chart in Figure 1 is a monthly chart of Facebook with an Elliott wave count suggesting that the share price is completing a WAVE 3 which could fall in a WAVE 4 to 146.54 or 131.94. The chart is also suggesting a PTI 99 (Probability Index) of a rise in a WAVE 5 to 245.90 once the WAVE 4 correction has been completed. The RSI-14 indicator has been at oversold levels all the time, but the Stochastic RSI did show a correction and a buy signal given on February 28, 2017. Do note how volume has slowly fallen as the share price rose, possibly because the higher share price has attracted less buyers. |
|
| Figure 2. Monthly chart of Apple. |
| Graphic provided by: AdvancedGET. |
| |
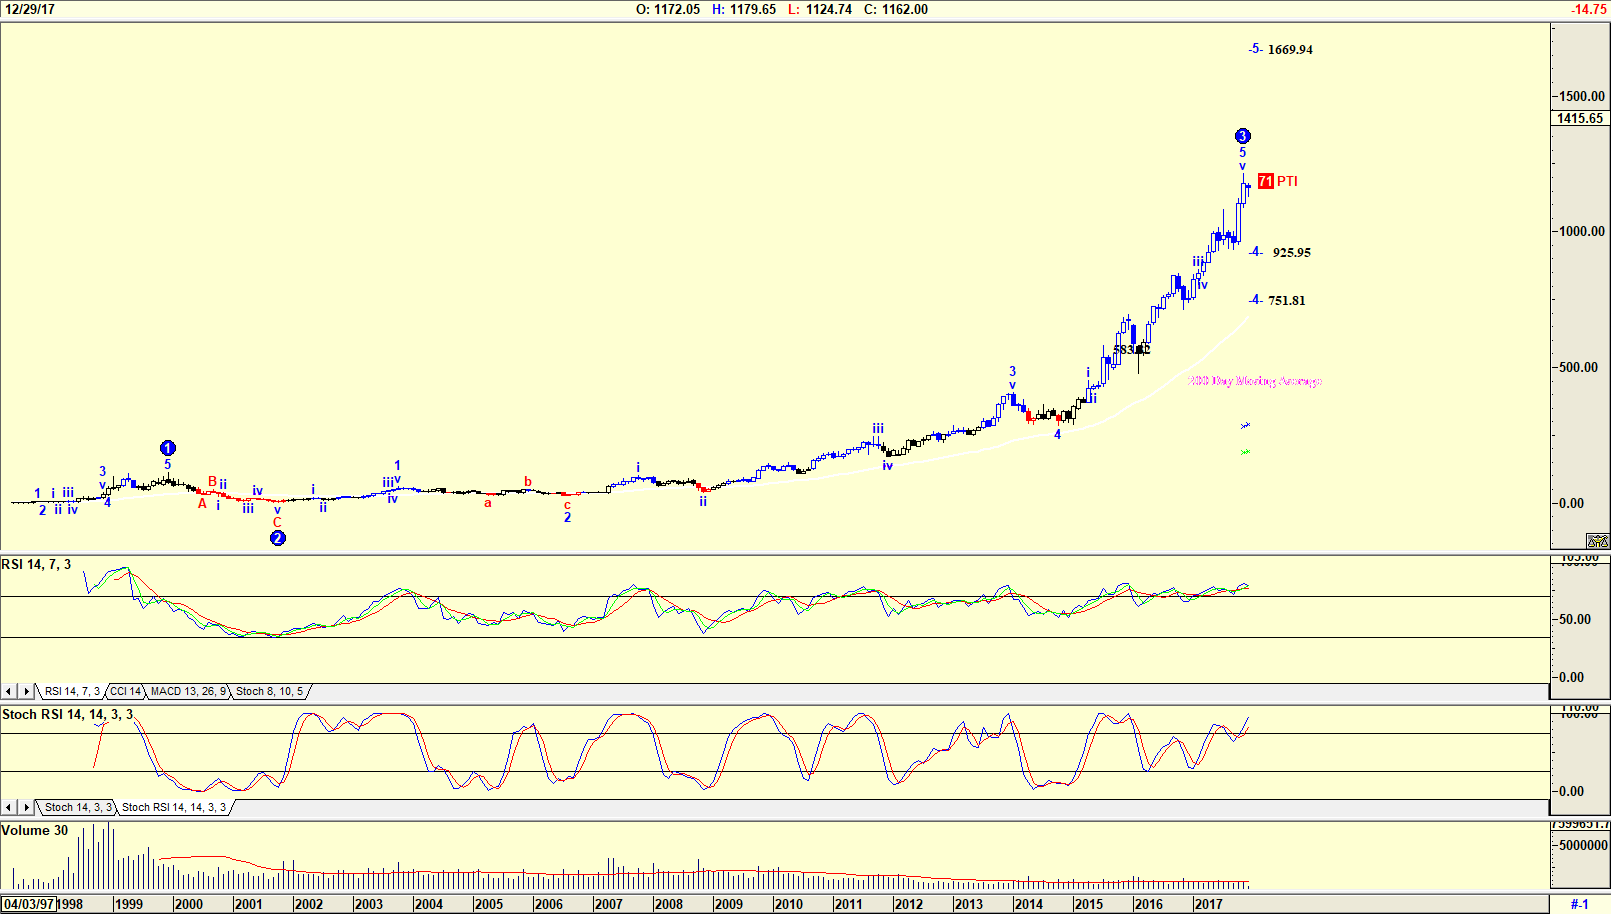
| The chart in Figure 2 is a monthly chart of AMAZON, with an Elliott wave count suggesting that the share price is in a WAVE 3 and could fall in a WAVE 4 to either 925.95 or 751.81. The PTI (Probability Index) is 71, suggesting that there is a 71% probability that once wave 4 is complete, the share price could rise in a WAVE 5 to $1889.94. Do note the two indicators which have given buy and sell signals and both are presently at overbought levels. Once again, volume has fallen as the share price rose. |
|
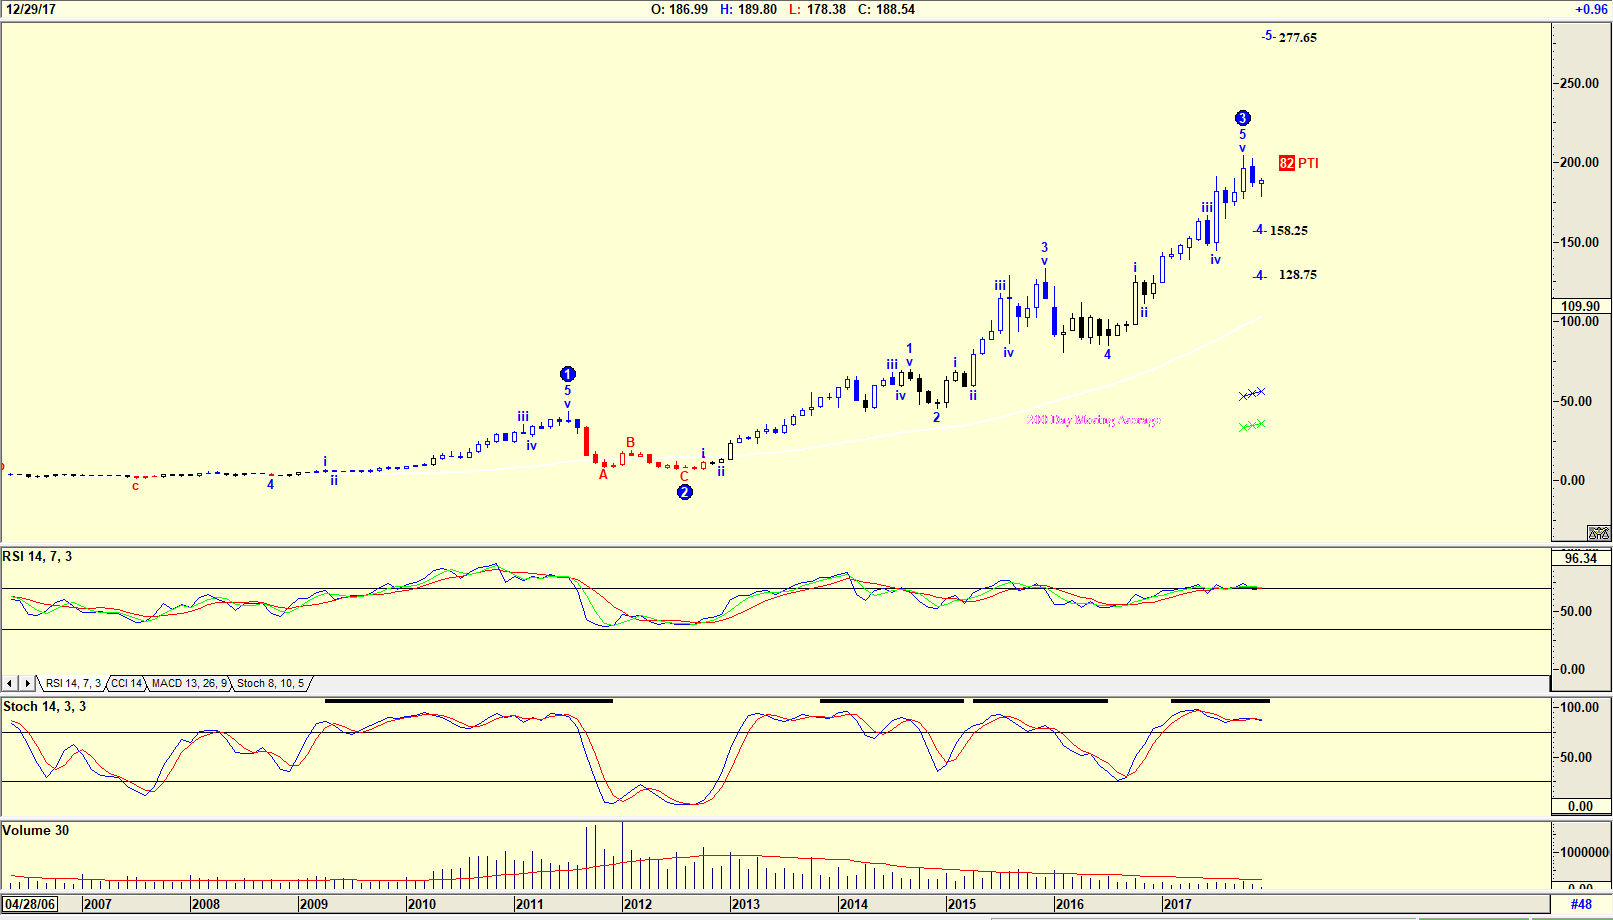
| Figure 3. Monthly chart of Netflix. |
| Graphic provided by: AdvancedGET. |
| |
| The chart in Figure 3 is a monthly chart of Netflix. The Elliott wave count is identical to the charts in Figure 1 and 2, with the share price completing a WAVE 3 and could possibly fall in a WAVE 4 to either 258.25 or 128.75. Once again, the PTI is high at 82, with a WAVE 5 target of 277.65 and with both indicators at oversold levels. |
|
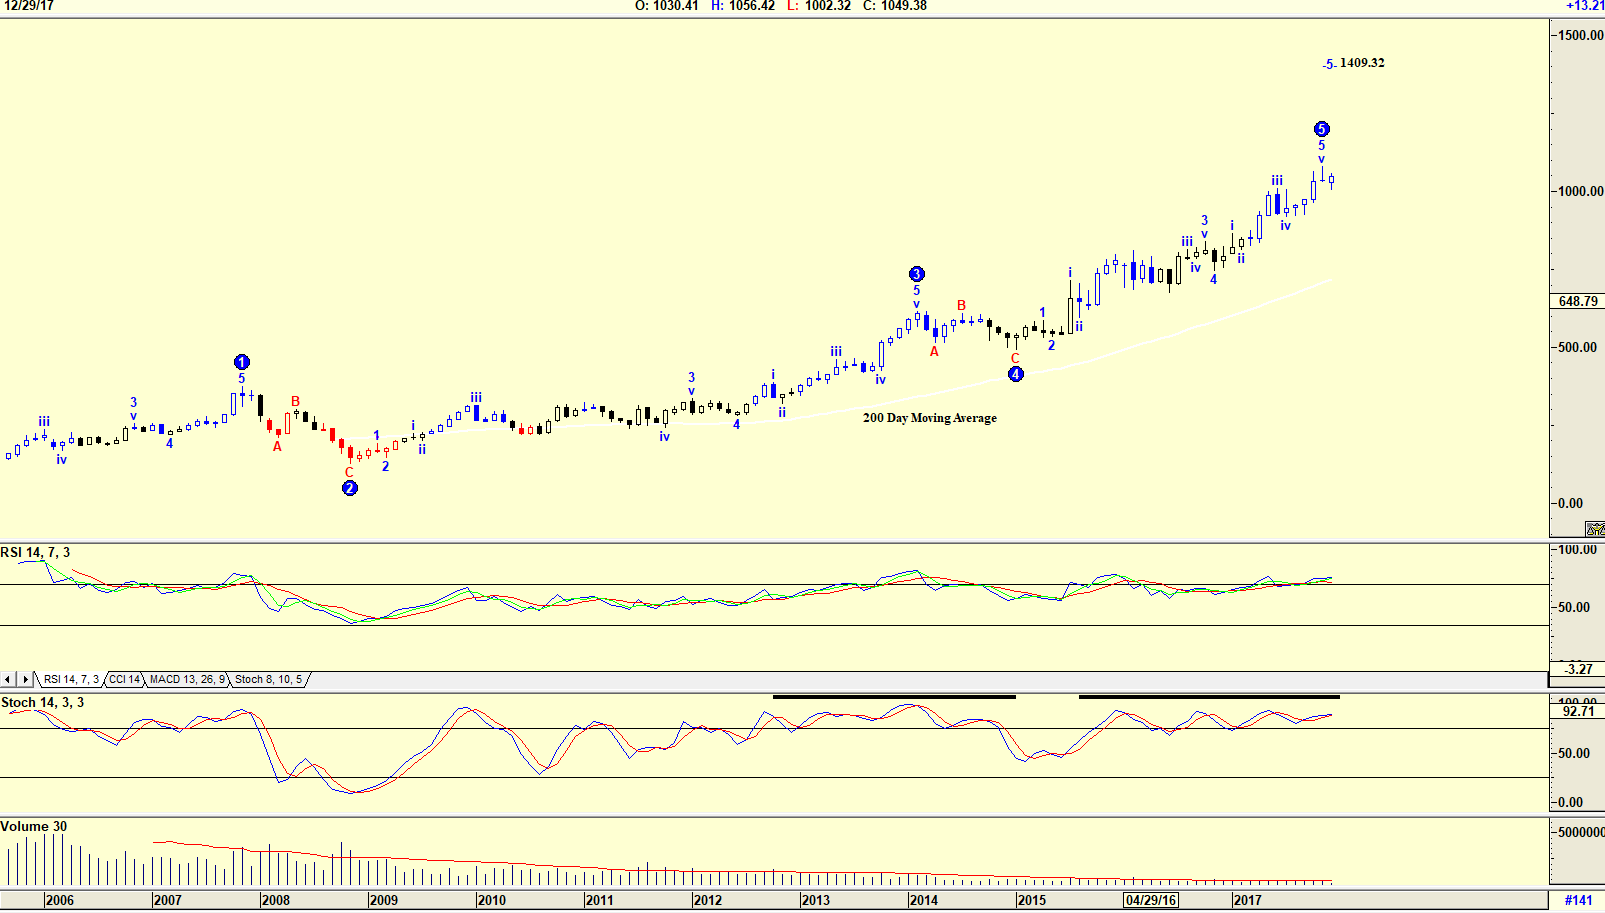
| Figure 4. Monthly chart of Google. |
| Graphic provided by: AdvancedGET. |
| |
| The chart in Figure 4 is a monthly chart of Google Class A. The chart is different from the charts in Figures 1, 2 and 3 in that the Elliott wave count is showing that the share price has completed a WAVE 4 and is in a WAVE 5 that could rise to 1409.32. Once again, the indicators are at overbought levels, and volume is low. All four charts are suggesting that a correction is on the cards, however, when, is the question. An Elliott wave count should have a WAVE 5 equal or less than that of WAVE 1. With computers becoming more and more active in market trading, a WAVE 5 has become shorter that a WAVE 1 simply because computers do not have emotions and trade the market following algorithms programmed. In the chart in Figure 4, so far WAVE 5 is greater than WAVE 1 suggesting that buyers are optimistic as to growth. Do note as well that all the charts show falling volume. When a share price rises and volume falls, that is usually a sign of weakness. However, because all four FANG stocks are at high prices, the reduction in volume could be because of less buyers as the price rises. The conclusion of analyzing the FANG stocks? A correction will occur, there is no doubt of that. The question is when? Will it be as the Bitcoin bubble bursts or will it be because of President Trump's irrational exuberance. Whatever the cause, caution should be the number one priority. |
Has been a technical analyst since 1969, and has worked as a futures and options trader with First Financial Futures in Johannesburg, South Africa.
| Address: | 3256 West 24th Ave |
| Vancouver, BC | |
| Phone # for sales: | 6042634214 |
| E-mail address: | petroosp@gmail.com |
Click here for more information about our publications!
Comments

Request Information From Our Sponsors
- StockCharts.com, Inc.
- Candle Patterns
- Candlestick Charting Explained
- Intermarket Technical Analysis
- John Murphy on Chart Analysis
- John Murphy's Chart Pattern Recognition
- John Murphy's Market Message
- MurphyExplainsMarketAnalysis-Intermarket Analysis
- MurphyExplainsMarketAnalysis-Visual Analysis
- StockCharts.com
- Technical Analysis of the Financial Markets
- The Visual Investor
- VectorVest, Inc.
- Executive Premier Workshop
- One-Day Options Course
- OptionsPro
- Retirement Income Workshop
- Sure-Fire Trading Systems (VectorVest, Inc.)
- Trading as a Business Workshop
- VectorVest 7 EOD
- VectorVest 7 RealTime/IntraDay
- VectorVest AutoTester
- VectorVest Educational Services
- VectorVest OnLine
- VectorVest Options Analyzer
- VectorVest ProGraphics v6.0
- VectorVest ProTrader 7
- VectorVest RealTime Derby Tool
- VectorVest Simulator
- VectorVest Variator
- VectorVest Watchdog