

HOT TOPICS LIST
- MACD
- Fibonacci
- RSI
- Gann
- ADXR
- Stochastics
- Volume
- Triangles
- Futures
- Cycles
- Volatility
- ZIGZAG
- MESA
- Retracement
- Aroon
INDICATORS LIST
LIST OF TOPICS
PRINT THIS ARTICLE
by Stella Osoba, CMT
AbbVie, Inc. (ABBV) is a large cap growth stock in the health care sector which has been on a tear for the bulk of 2017. It recently tested and retreated from its prior high. The question now is, what does this bode for the stock?
Position: N/A
Stella Osoba, CMT
Stella Osoba is a trader and financial writer. She is a frequent contributor to "Technical Analysis of Stocks and Commodities" magazine and "Traders.com Advantage" as well as other financial publications.
PRINT THIS ARTICLE
TECHNICAL ANALYSIS
Will AbbVie Break to the Downside?
12/27/17 04:43:40 PMby Stella Osoba, CMT
AbbVie, Inc. (ABBV) is a large cap growth stock in the health care sector which has been on a tear for the bulk of 2017. It recently tested and retreated from its prior high. The question now is, what does this bode for the stock?
Position: N/A
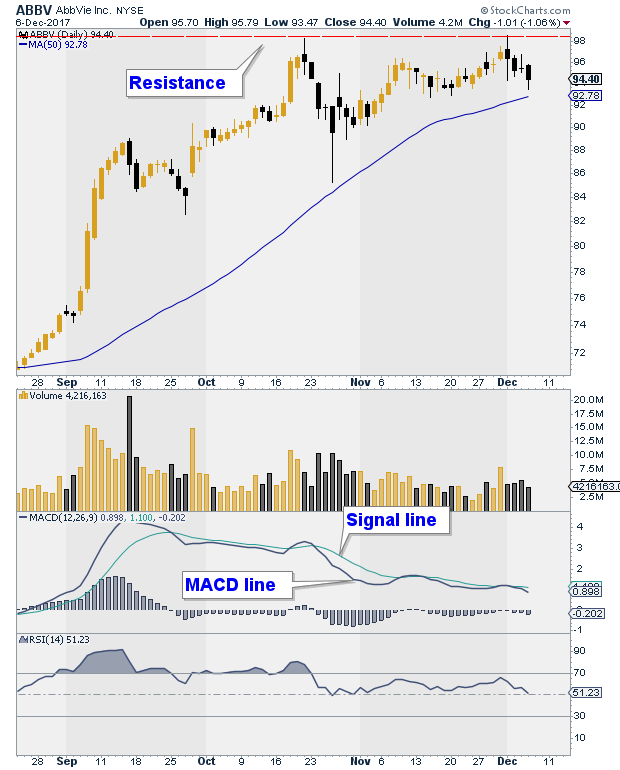
| One of the clues that a stock might be about to breakdown is an unsuccessful test of a prior high. In this case ABBV reached a high of 98.26 on October 20, 2017, on December 1, 2017, it tested that high. A glance at the chart will show that ABBV has retreated from the high and is now hovering just above its 50-day moving average. So the question to ask is, is this a good time to get bearish on the stock? |
| While it is possible that ABBV will break to the downside, I think basing your analysis on just one factor, the failed test will make the trade premature. It is much better to take a weight of the evidence approach in order to reduce the chances of getting caught on the wrong side of a trade. Here we have a few tools available to help us with the analysis. |
|
| Figure 1. Daily chart for ABBV. |
| Graphic provided by: StockCharts.com. |
| |
| The MACD which is produced below the price chart clearly shows negative divergence. This is when price is forming higher highs, but the indicator refuses to confirm by forming lower highs. Even though negative divergence is bearish, it is not the holy grail of trading signals. There are many times when negative divergences do not work, this is especially true in strong bull markets such as the one we are experiencing. The fact that the signal line is above the MACD line is bearish, but since both lines; the signal and the MACD line are above the zero center line we have to be cautious before relying too heavily on it. |
| Below the MACD panel we have a panel showing RSI which is a very popular indicator. The RSI has recently turned down and is touching the center line from above, but note that it has not yet crossed below it. RSI is still bullish. Looking back at the chart, even though we have four days of bearish candles, it is wise to wait to see if price manages to close below the 50-day moving average to make a determination about taking the short side of the trade. Price currently appear to be finding support at the 50-day moving average. The prominent lower tail of the most recent candle points to buying pressure coming in. It could well be that this pressure is overcome by further selling, but why guess? The best trades do not require crystal balls. Let the stock tell you what it is doing and then enter the trade. In my experience, it is far too easy to get caught on the wrong side of a trade, and this often happens because we give in to the temptation to anticipate what a stock will do. |
Stella Osoba is a trader and financial writer. She is a frequent contributor to "Technical Analysis of Stocks and Commodities" magazine and "Traders.com Advantage" as well as other financial publications.
| E-mail address: | stellaosoba@gmail.com |
Click here for more information about our publications!
PRINT THIS ARTICLE

Request Information From Our Sponsors
- VectorVest, Inc.
- Executive Premier Workshop
- One-Day Options Course
- OptionsPro
- Retirement Income Workshop
- Sure-Fire Trading Systems (VectorVest, Inc.)
- Trading as a Business Workshop
- VectorVest 7 EOD
- VectorVest 7 RealTime/IntraDay
- VectorVest AutoTester
- VectorVest Educational Services
- VectorVest OnLine
- VectorVest Options Analyzer
- VectorVest ProGraphics v6.0
- VectorVest ProTrader 7
- VectorVest RealTime Derby Tool
- VectorVest Simulator
- VectorVest Variator
- VectorVest Watchdog
- StockCharts.com, Inc.
- Candle Patterns
- Candlestick Charting Explained
- Intermarket Technical Analysis
- John Murphy on Chart Analysis
- John Murphy's Chart Pattern Recognition
- John Murphy's Market Message
- MurphyExplainsMarketAnalysis-Intermarket Analysis
- MurphyExplainsMarketAnalysis-Visual Analysis
- StockCharts.com
- Technical Analysis of the Financial Markets
- The Visual Investor