HOT TOPICS LIST
- MACD
- Fibonacci
- RSI
- Gann
- ADXR
- Stochastics
- Volume
- Triangles
- Futures
- Cycles
- Volatility
- ZIGZAG
- MESA
- Retracement
- Aroon
INDICATORS LIST
LIST OF TOPICS
PRINT THIS ARTICLE
by Koos van der Merwe
This past few weeks saw tremendous market fluctuation because of Michael Flynn, and also because of a vote in the American Senate on a tax bill.
Position: Sell
Koos van der Merwe
Has been a technical analyst since 1969, and has worked as a futures and options trader with First Financial Futures in Johannesburg, South Africa.
PRINT THIS ARTICLE
TECHNICAL ANALYSIS
Trading With Emotions
12/14/17 03:46:26 PMby Koos van der Merwe
This past few weeks saw tremendous market fluctuation because of Michael Flynn, and also because of a vote in the American Senate on a tax bill.
Position: Sell
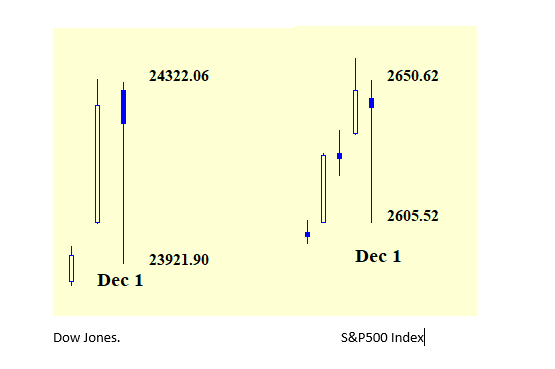
| On Thursday, November 30, the Dow opened at 24013.80 and rose to a high of 24327.80, an increase of 314 points. The Dow closed at 24,272.35, rising 258.55. On Friday, December 1, the Dow opened at 24305.40 and dropped to a low of 23921.90, a drop of 383.50 points before closing at 24231.59, only 73.45 points down. Two days of interesting stress that many traders profited on and many traders lost on. So what is the answer? Simple, cut out the emotion and trade following your charts and your indicators. When you switch on your TV, don't let the news or Trumponomics influence your trading. |

|
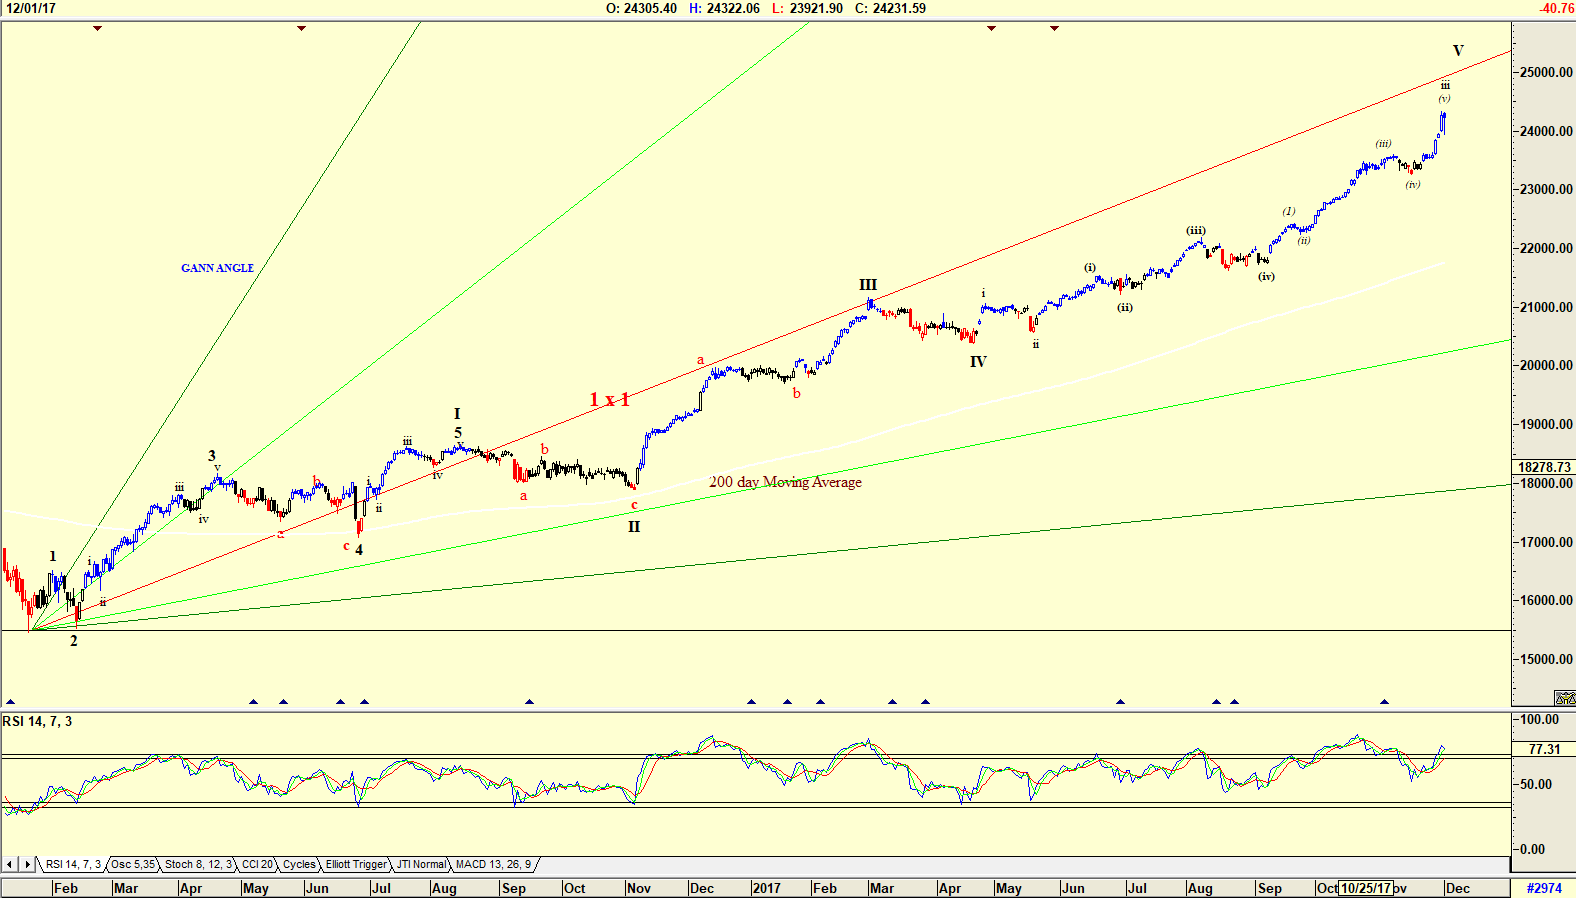
| Figure 1. Daily chart of the Dow. |
| Graphic provided by: AdvancedGET. |
| |
| Looking at the chart of the Dow in Figure 1, the Elliott wave count does not make sense. Yes, the count could be wrong and probably is, and future trading will resolve the error, but the RSI indicator is suggesting that a divergence sell could be in the wings. A divergence sell is where the Dow will rise higher but the indicator will fall. Also note that the index is close to the 1 x 1 Gann angle, suggesting a possible correction could occur anytime. |

|
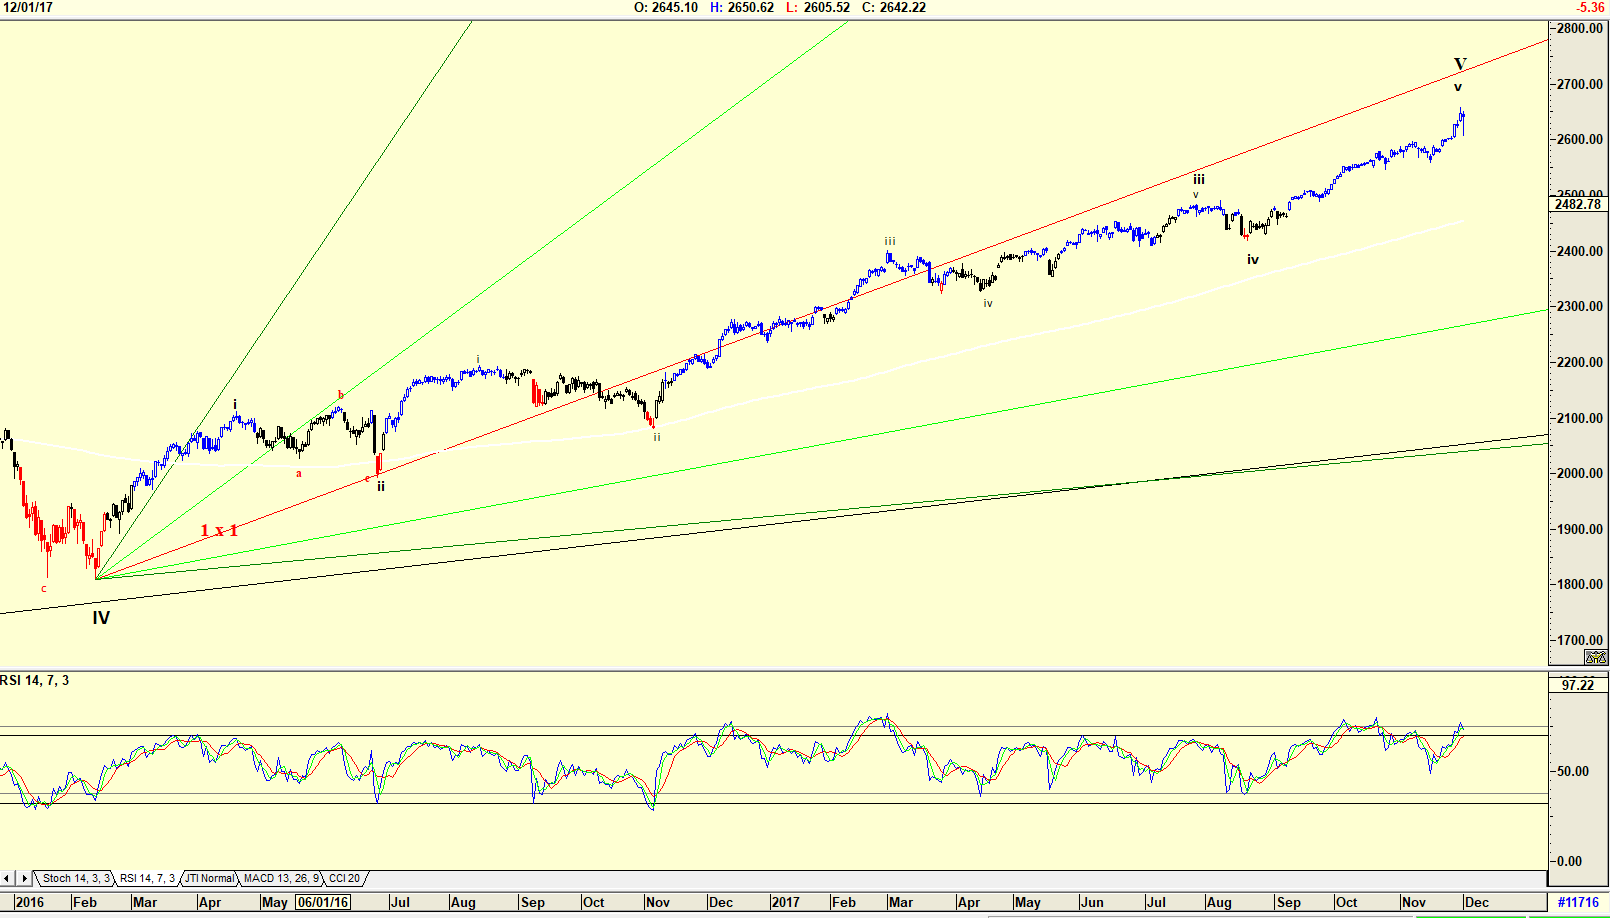
| Figure 2. Daily chart of the S&P 500 Index. |
| Graphic provided by: AdvancedGET. |
| |
| The chart in Figure 2 is a chart of the S&P 500 Index over the same time period as the chart in Figure 1. However, the Elliott wave count is a great deal more accurate, and is also suggesting that a WAVE V to is about to occur. Looking at the chart, we can see that although the index dropped strongly on December 1, and recovered, it did not move on November 30 the same way as the Dow did. Is this because the Index is made up of more stocks than the Dow? Possibly. Do note that the RSI Index is also at overbought levels. |

|
| Figure 3. November 30 and December 1 for both the Dow and S&P 500. |
| Graphic provided by: AdvancedGET. |
| |
| The chart in Figure 3 is a chart of the Dow and the S&P 500 Index over November 30 and December 1. Both charts show a candlestick pattern that looks bearish. So, does one follow the craziness that comes over the news every day, as more and more events occur that can harm the American Presidency? Or does one simply insert earplugs and follow the charts and ignore the news? Of course, following the indicators and your charts is the answer. |
Has been a technical analyst since 1969, and has worked as a futures and options trader with First Financial Futures in Johannesburg, South Africa.
| Address: | 3256 West 24th Ave |
| Vancouver, BC | |
| Phone # for sales: | 6042634214 |
| E-mail address: | petroosp@gmail.com |
Click here for more information about our publications!
PRINT THIS ARTICLE

Request Information From Our Sponsors
- StockCharts.com, Inc.
- Candle Patterns
- Candlestick Charting Explained
- Intermarket Technical Analysis
- John Murphy on Chart Analysis
- John Murphy's Chart Pattern Recognition
- John Murphy's Market Message
- MurphyExplainsMarketAnalysis-Intermarket Analysis
- MurphyExplainsMarketAnalysis-Visual Analysis
- StockCharts.com
- Technical Analysis of the Financial Markets
- The Visual Investor
- VectorVest, Inc.
- Executive Premier Workshop
- One-Day Options Course
- OptionsPro
- Retirement Income Workshop
- Sure-Fire Trading Systems (VectorVest, Inc.)
- Trading as a Business Workshop
- VectorVest 7 EOD
- VectorVest 7 RealTime/IntraDay
- VectorVest AutoTester
- VectorVest Educational Services
- VectorVest OnLine
- VectorVest Options Analyzer
- VectorVest ProGraphics v6.0
- VectorVest ProTrader 7
- VectorVest RealTime Derby Tool
- VectorVest Simulator
- VectorVest Variator
- VectorVest Watchdog
