

HOT TOPICS LIST
- MACD
- Fibonacci
- RSI
- Gann
- ADXR
- Stochastics
- Volume
- Triangles
- Futures
- Cycles
- Volatility
- ZIGZAG
- MESA
- Retracement
- Aroon
INDICATORS LIST
LIST OF TOPICS
PRINT THIS ARTICLE
by Stella Osoba, CMT
Sometimes the best time to enter a long position is when others are afraid. Because we are all mostly wired alike, being very afraid might not be a bad gauge to add to your tools to help you determine when a long trade might be at its most attractive.
Position: N/A
Stella Osoba, CMT
Stella Osoba is a trader and financial writer. She is a frequent contributor to "Technical Analysis of Stocks and Commodities" magazine and "Traders.com Advantage" as well as other financial publications.
PRINT THIS ARTICLE
TECHNICAL ANALYSIS
Be Very Afraid
12/21/17 03:19:14 PMby Stella Osoba, CMT
Sometimes the best time to enter a long position is when others are afraid. Because we are all mostly wired alike, being very afraid might not be a bad gauge to add to your tools to help you determine when a long trade might be at its most attractive.
Position: N/A
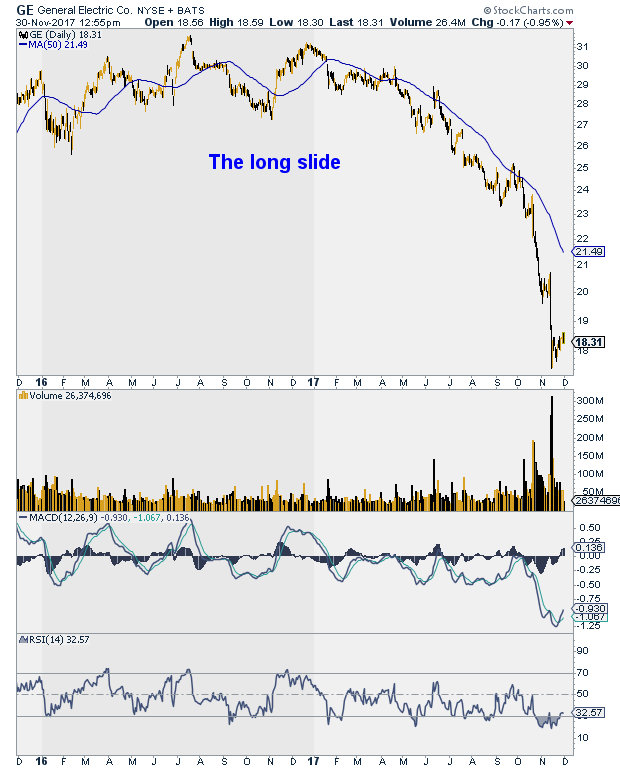
| General Electric Co. (GE) topped in July of 2016. Six months later, in December of 2016, it tested its July 2016 high of $31.66 but fell short at $31.30. From that point, it began a long sustained fall. (See Figure 1) The decline accelerated in October 2017 reaching a low of $17.46 on November 14, 2017. |
|
| Figure 1: GE Daily. |
| Graphic provided by: StockCharts.com. |
| |
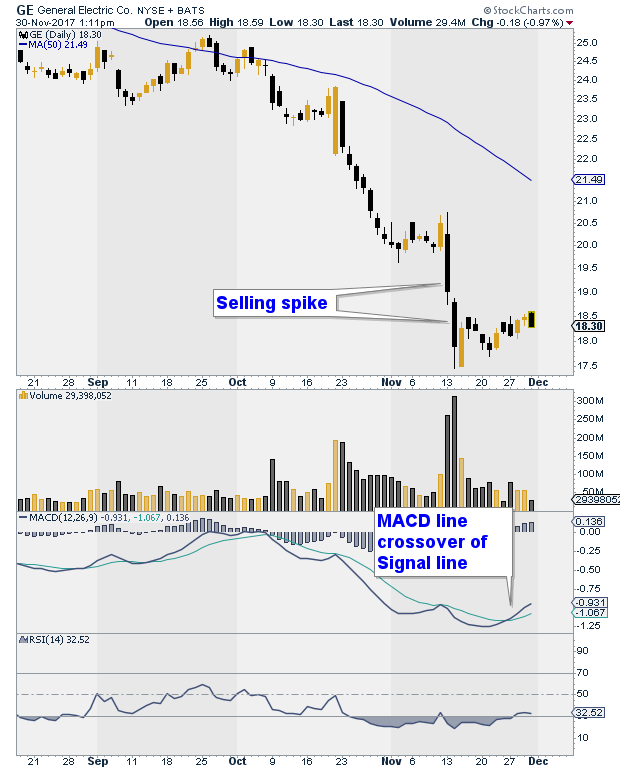
| The selling spike on November 13 and 14 was marked by extremely high volume, especially on the 14th when prices closed up from the day's low. (See Figure 2) This suggested buying pressure was confirmed by the bull candle that formed the following day. The following two weeks have been marked by lower volatility, but also if we study the chart we can see that the low formed on November 21 was higher than the low preceding it. This subtle change in the character of the chart might signal the end of the downtrend. |
|
| Figure 2. GE Daily. |
| Graphic provided by: StockCharts.com. |
| |
| What next for GE? The end of a price downtrend does not mean that the new trend will be up. Price can move sideways and churn for a considerable period of time before the trend changes from down to up. This is why it is worth putting this stock on your radar and watching it carefully to see what price action will do. It is always possible that this is merely a pause and the prevailing trend will continue down. |
| But it is also possible that the signals which at the moment are very subtle are pointing to the beginning of a reversal. Take note of the fact that the MACD line has crossed above the signal line from below which is a bullish sign, but remember that the fact that both lines are below zero is bearish. Also the RSI, which was recently in oversold territory, and has now turned upwards is bullish, but again the fact that RSI is at 32 is bearish. |
| Note also, that overall the chart of GE is still bearish. For the aggressive trader, a very bearish chart is sometimes positive, for there is often a level at which a trend halts and eventually reverses. That is the level when most people looking at the chart will be very afraid to go against the prevailing trend. It is also often the case that changes in strong trends can be subtle. While most people are looking for a continuation of the earlier trend, the vigilant are entering long positions and getting well placed for the eventual reversal. Having said that, be sure to use well placed stops if you are tempted to get in early and take the long side of this trade. And take note of the fact that this piece is educational only. |
Stella Osoba is a trader and financial writer. She is a frequent contributor to "Technical Analysis of Stocks and Commodities" magazine and "Traders.com Advantage" as well as other financial publications.
| E-mail address: | stellaosoba@gmail.com |
Click here for more information about our publications!
PRINT THIS ARTICLE

Request Information From Our Sponsors
- VectorVest, Inc.
- Executive Premier Workshop
- One-Day Options Course
- OptionsPro
- Retirement Income Workshop
- Sure-Fire Trading Systems (VectorVest, Inc.)
- Trading as a Business Workshop
- VectorVest 7 EOD
- VectorVest 7 RealTime/IntraDay
- VectorVest AutoTester
- VectorVest Educational Services
- VectorVest OnLine
- VectorVest Options Analyzer
- VectorVest ProGraphics v6.0
- VectorVest ProTrader 7
- VectorVest RealTime Derby Tool
- VectorVest Simulator
- VectorVest Variator
- VectorVest Watchdog
- StockCharts.com, Inc.
- Candle Patterns
- Candlestick Charting Explained
- Intermarket Technical Analysis
- John Murphy on Chart Analysis
- John Murphy's Chart Pattern Recognition
- John Murphy's Market Message
- MurphyExplainsMarketAnalysis-Intermarket Analysis
- MurphyExplainsMarketAnalysis-Visual Analysis
- StockCharts.com
- Technical Analysis of the Financial Markets
- The Visual Investor