

HOT TOPICS LIST
- MACD
- Fibonacci
- RSI
- Gann
- ADXR
- Stochastics
- Volume
- Triangles
- Futures
- Cycles
- Volatility
- ZIGZAG
- MESA
- Retracement
- Aroon
INDICATORS LIST
LIST OF TOPICS
PRINT THIS ARTICLE
by Stella Osoba, CMT
Deere & Co (DE) had been in an uptrend for much of the past year like many other industrials. But with the recent hangman candlestick pattern formation, it is time to reassess DE's bull trend.
Position: N/A
Stella Osoba, CMT
Stella Osoba is a trader and financial writer. She is a frequent contributor to "Technical Analysis of Stocks and Commodities" magazine and "Traders.com Advantage" as well as other financial publications.
PRINT THIS ARTICLE
CANDLESTICK CHARTING
Beware The Hanging Man
12/14/17 03:40:52 PMby Stella Osoba, CMT
Deere & Co (DE) had been in an uptrend for much of the past year like many other industrials. But with the recent hangman candlestick pattern formation, it is time to reassess DE's bull trend.
Position: N/A
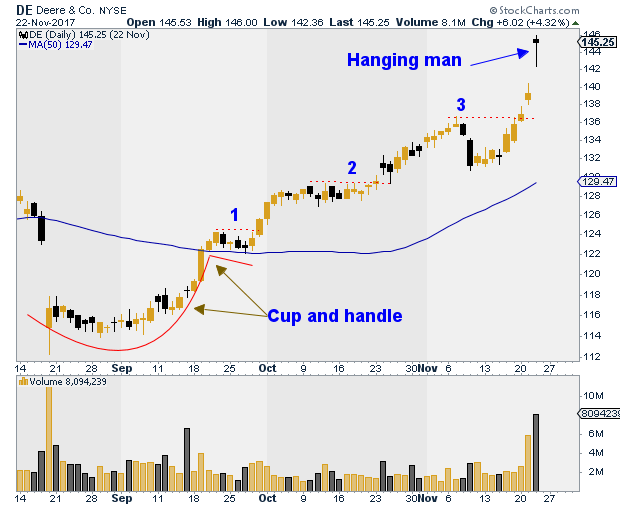
| After a steep drop in August 2017, DE formed a cup pattern (marked on chart in Figure 1) and broke above its 50-day moving average on high volume. It found support above the 50-day moving average and tracked the average for 7 days (to form the handle in the cup and handle pattern) before it broke out to form a new high. The breakout at 1 (marked on the chart) would have made for a good long entry. One could have added to long positions at 2 and possibly 3 as indicated on the chart. Each time, price broke out to new highs after mild declines. |
| The decline before the break out at 3 was steeper than the previous two. The changing nature of the decline should cause us to pay attention. While it was not necessary to be preemptive and exit the trade early it was necessary to now pay closer attention to price as the character of the trend appeared to be changing. After the breakout at 3, price gapped up (or formed a window in candlestick parlance) on extremely high volume the following day. And the next day was another large gap-up day which ended in the formation of the hanging man candlestick pattern. The decline at 3 had forewarned us to pay attention to the changing character of the chart. Now we can see that the uptrend appears to be in some trouble. |
|
| Figure 1. Daily chart for DE with hanging man candle. |
| Graphic provided by: StockCharts.com. |
| |
| The hanging man is a one day candlestick pattern. It is a bearish reversal signal which forms after a price advance. The candlestick should have a long lower tail, a small body at or near the top of the pattern and a small or non existent upper shadow. Often long lower shadows are bullish because it shows that bulls were able to push price up from its lows. But it can also have the opposite interpretation, as in this case. Here the long lower shadow shows that bears were able to push prices down. The bulls were then able to push price back up, but the existence of the long lower shadow is proof of selling. Also note the extremely high volume on the chart. |
| The hanging man needs confirmation. It is still possible for buying pressure to come in on subsequent days, sending price higher than the high of the hanging man. So in the absence of confirmation, which should be a decisive break down such as a long bearish candle or a gap down, it is best to raise stops and wait for more information. Do not initiate a short position simply because of the formation of a hanging man. |
| The close on the day after the formation of the hanging man, on November 23, was a bearish candle. The long upper tail and close at the day's low shows that the selling pressure has continued and bulls have not been able to overcome the selling. It is time to move stops higher if you have not already done so, and get ready to exit the long trade if price weakens further and breaks below the low of the hanging man candle. |
Stella Osoba is a trader and financial writer. She is a frequent contributor to "Technical Analysis of Stocks and Commodities" magazine and "Traders.com Advantage" as well as other financial publications.
| E-mail address: | stellaosoba@gmail.com |
Click here for more information about our publications!
Comments

Request Information From Our Sponsors
- StockCharts.com, Inc.
- Candle Patterns
- Candlestick Charting Explained
- Intermarket Technical Analysis
- John Murphy on Chart Analysis
- John Murphy's Chart Pattern Recognition
- John Murphy's Market Message
- MurphyExplainsMarketAnalysis-Intermarket Analysis
- MurphyExplainsMarketAnalysis-Visual Analysis
- StockCharts.com
- Technical Analysis of the Financial Markets
- The Visual Investor
- VectorVest, Inc.
- Executive Premier Workshop
- One-Day Options Course
- OptionsPro
- Retirement Income Workshop
- Sure-Fire Trading Systems (VectorVest, Inc.)
- Trading as a Business Workshop
- VectorVest 7 EOD
- VectorVest 7 RealTime/IntraDay
- VectorVest AutoTester
- VectorVest Educational Services
- VectorVest OnLine
- VectorVest Options Analyzer
- VectorVest ProGraphics v6.0
- VectorVest ProTrader 7
- VectorVest RealTime Derby Tool
- VectorVest Simulator
- VectorVest Variator
- VectorVest Watchdog