HOT TOPICS LIST
- MACD
- Fibonacci
- RSI
- Gann
- ADXR
- Stochastics
- Volume
- Triangles
- Futures
- Cycles
- Volatility
- ZIGZAG
- MESA
- Retracement
- Aroon
INDICATORS LIST
LIST OF TOPICS
PRINT THIS ARTICLE
by Koos van der Merwe
Sylvain Vervoort is a market analyst that has developed market trading strategies.
Position: Buy
Koos van der Merwe
Has been a technical analyst since 1969, and has worked as a futures and options trader with First Financial Futures in Johannesburg, South Africa.
PRINT THIS ARTICLE
TECHNICAL ANALYSIS
An Indicator To Follow
12/07/17 09:41:34 AMby Koos van der Merwe
Sylvain Vervoort is a market analyst that has developed market trading strategies.
Position: Buy
| If you Google the name, Sylvain Vervoort, you fill find many pages about his book on stock market analysis. He then started publishing excerpts from his book with Technical Analysis of Stocks and Commodities and found a solid following. One of the best indicators I found was the Vervoort Stop Strategy, and using the Omnitrader program, I added this stop strategy to my indicators and found it very effective, so much so that last month I decided to write it as a BUY/SELL strategy and was very happy with the result. Where my other market strategies on Omnitrader are giving me negative portfolios so far for November, the Vervoort Strategy is in positive territory. Below are charts of the shares it has chosen as buys after analysis ending November 24. |

|
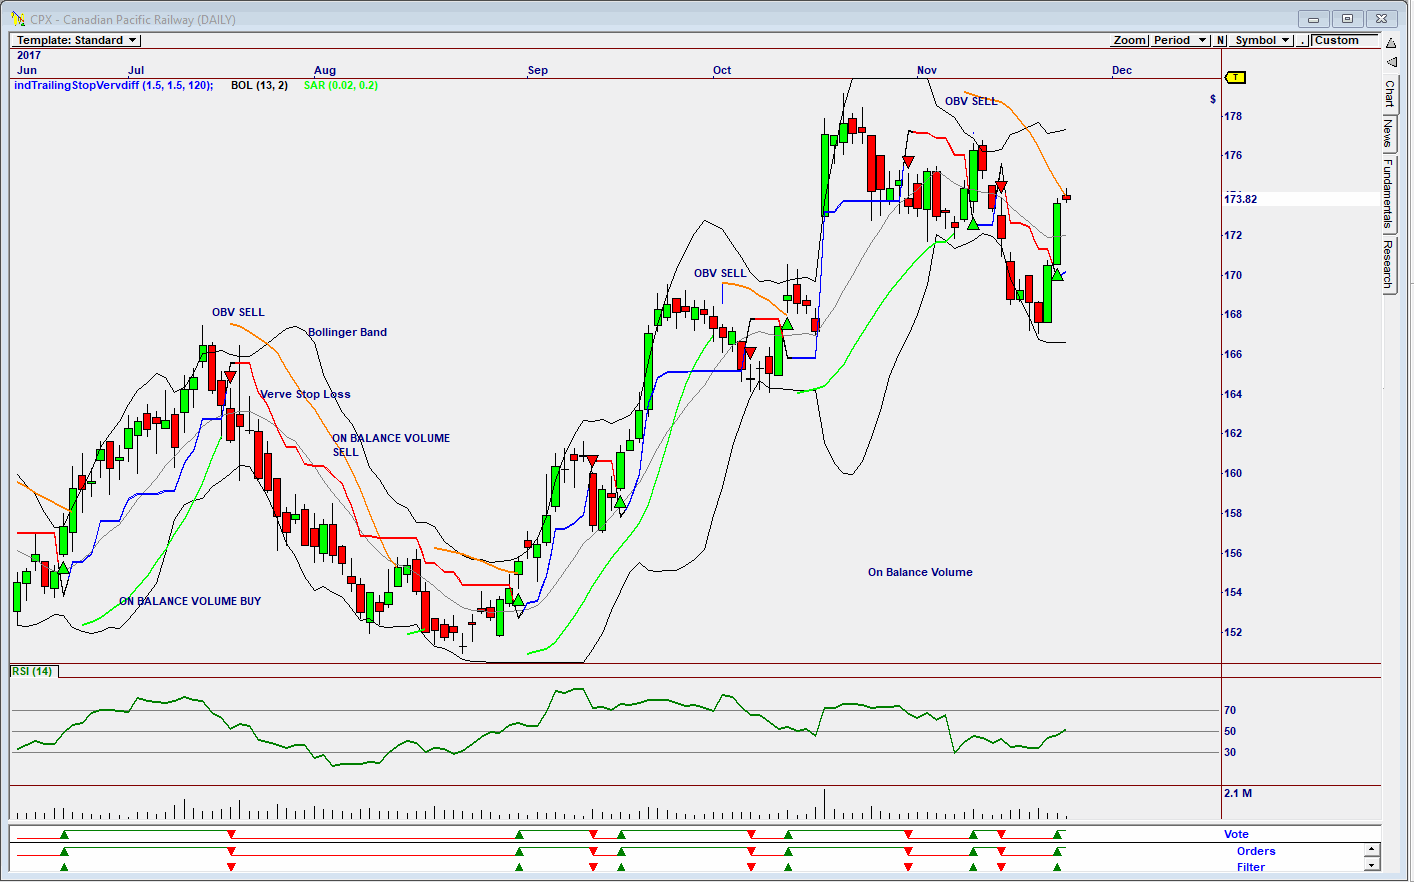
| Figure 1. Chart showing a buy. |
| Graphic provided by: Omnitrader. |
| |
| The share in Figure 1 is an Omnitrader Chart of Canadian Pacific Railway. Note on the chart the buy/sell signals given on the Vote line. One thing that did disturb me was that in some instances the sell signals were given late. Here I suggest that one should apply a stop loss strategy to sell the share. I have added the On Balance Volume indicator to suggest a sell signal if the Vervoort Strategy is late in suggesting a sell. The buy signals are always acceptable, even if they are a few days late. |

|
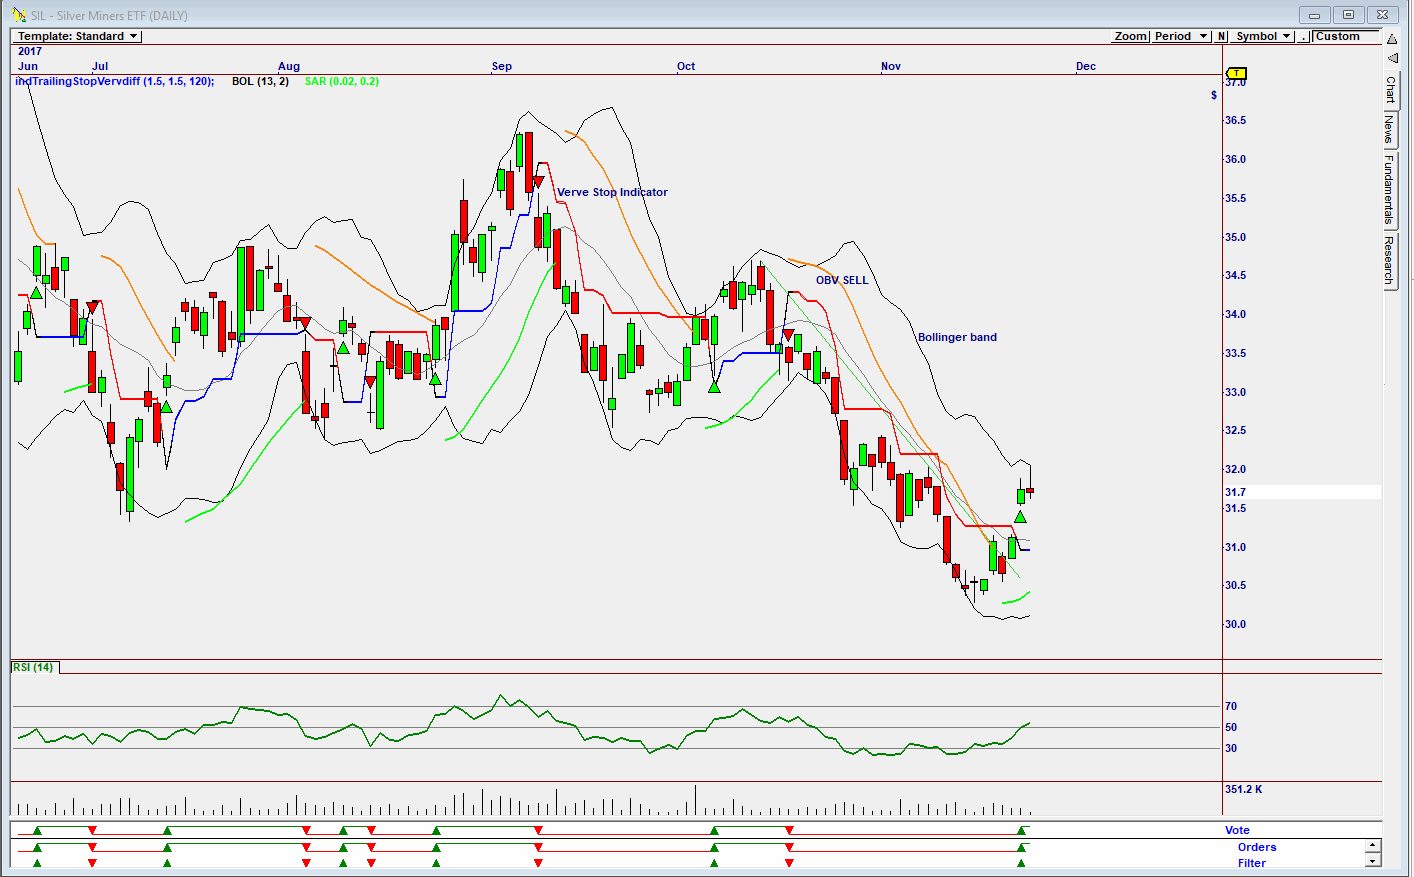
| Figure 2. Chart showing a buy. |
| Graphic provided by: Omnitrader. |
| |
| The chart in Figure 2 is a chart of Silver Miners (SIL) where a buy signal has been given on November 22. Do note that the current price is testing the upper Bollinger band, which should make one more cautious with a buy, probably causing stops to be close. Also note that volume has fallen as the share price rose, suggesting weakness. |

|
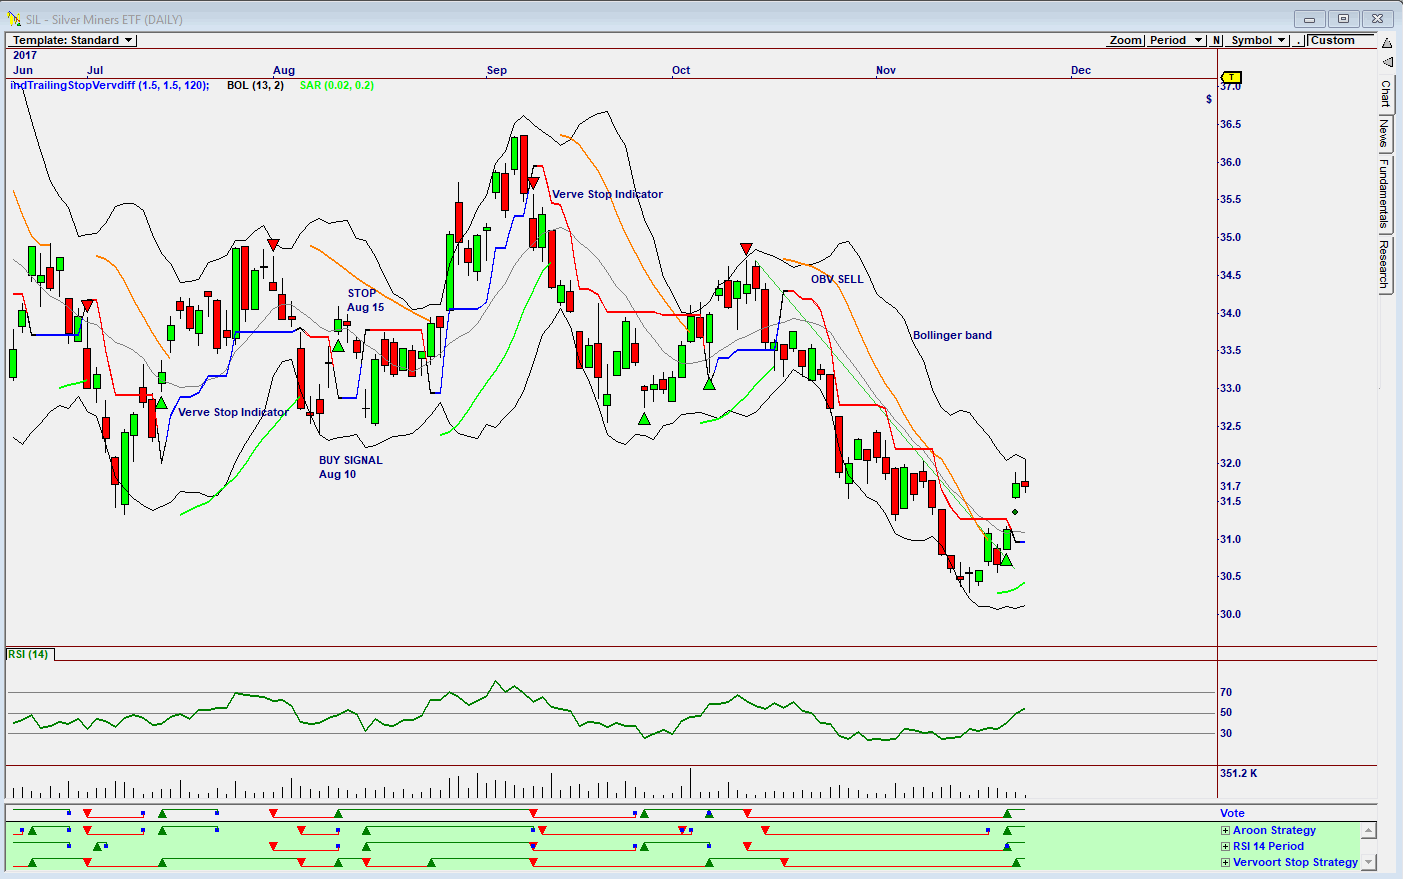
| Figure 3. Chart with suggestions. |
| Graphic provided by: Omnitrader. |
| |
| In Figure 3 I have added the AROON strategy and the RSI-14 Strategy to the chart. Note that both buy and sell signals on the Vote line are suggested earlier. The buy signal given on August 10 however was given early, and although the final result was successful, the share would have been stopped out on August 15 as the share fell below the Verve Stop indicator. Playing with Omnitrader one can add various strategies that are written and test which combination suggests the best results. So far, I have found Vervoort Stop Strategy to be the best for my personality. Enjoy. |
Has been a technical analyst since 1969, and has worked as a futures and options trader with First Financial Futures in Johannesburg, South Africa.
| Address: | 3256 West 24th Ave |
| Vancouver, BC | |
| Phone # for sales: | 6042634214 |
| E-mail address: | petroosp@gmail.com |
Click here for more information about our publications!
PRINT THIS ARTICLE

Request Information From Our Sponsors
- StockCharts.com, Inc.
- Candle Patterns
- Candlestick Charting Explained
- Intermarket Technical Analysis
- John Murphy on Chart Analysis
- John Murphy's Chart Pattern Recognition
- John Murphy's Market Message
- MurphyExplainsMarketAnalysis-Intermarket Analysis
- MurphyExplainsMarketAnalysis-Visual Analysis
- StockCharts.com
- Technical Analysis of the Financial Markets
- The Visual Investor
- VectorVest, Inc.
- Executive Premier Workshop
- One-Day Options Course
- OptionsPro
- Retirement Income Workshop
- Sure-Fire Trading Systems (VectorVest, Inc.)
- Trading as a Business Workshop
- VectorVest 7 EOD
- VectorVest 7 RealTime/IntraDay
- VectorVest AutoTester
- VectorVest Educational Services
- VectorVest OnLine
- VectorVest Options Analyzer
- VectorVest ProGraphics v6.0
- VectorVest ProTrader 7
- VectorVest RealTime Derby Tool
- VectorVest Simulator
- VectorVest Variator
- VectorVest Watchdog
