HOT TOPICS LIST
- MACD
- Fibonacci
- RSI
- Gann
- ADXR
- Stochastics
- Volume
- Triangles
- Futures
- Cycles
- Volatility
- ZIGZAG
- MESA
- Retracement
- Aroon
INDICATORS LIST
LIST OF TOPICS
PRINT THIS ARTICLE
by Koos van der Merwe
Today there are many indicators out there that suggest when to buy or sell a share.
Position: Sell
Koos van der Merwe
Has been a technical analyst since 1969, and has worked as a futures and options trader with First Financial Futures in Johannesburg, South Africa.
PRINT THIS ARTICLE
TECHNICAL ANALYSIS
The Best Indicator
12/01/17 04:25:12 PMby Koos van der Merwe
Today there are many indicators out there that suggest when to buy or sell a share.
Position: Sell
| With all the indicators available, offered by the programs purchased to analyze the stock market, which indicator out of all of them, gives the best return? For example, in the Metastock program I have there are 77 indicators. In the Advanced GET program I use, there are 14 indicators, and an Elliott wave count that is very effective. In the program Omnitrader Plus, the indicators available are many, and with the ability to write one's own indicator, almost unlimited. So, in all my years of trading with Metastock since the program first came out, with Advanced GET and with Omnitrader, a program where I wrote my own indicators and strategies, which indicator has proved to be the best? Quite honestly, I found that the best indicator depends on one's personality and market stress. So what indicator do I prefer to use? Of course, Wells Wilder's RSI-14 is top of the list, but a lady I met many years ago, told me that she traded with a moving average band strategy for many years, which was "very kind to her." |

|
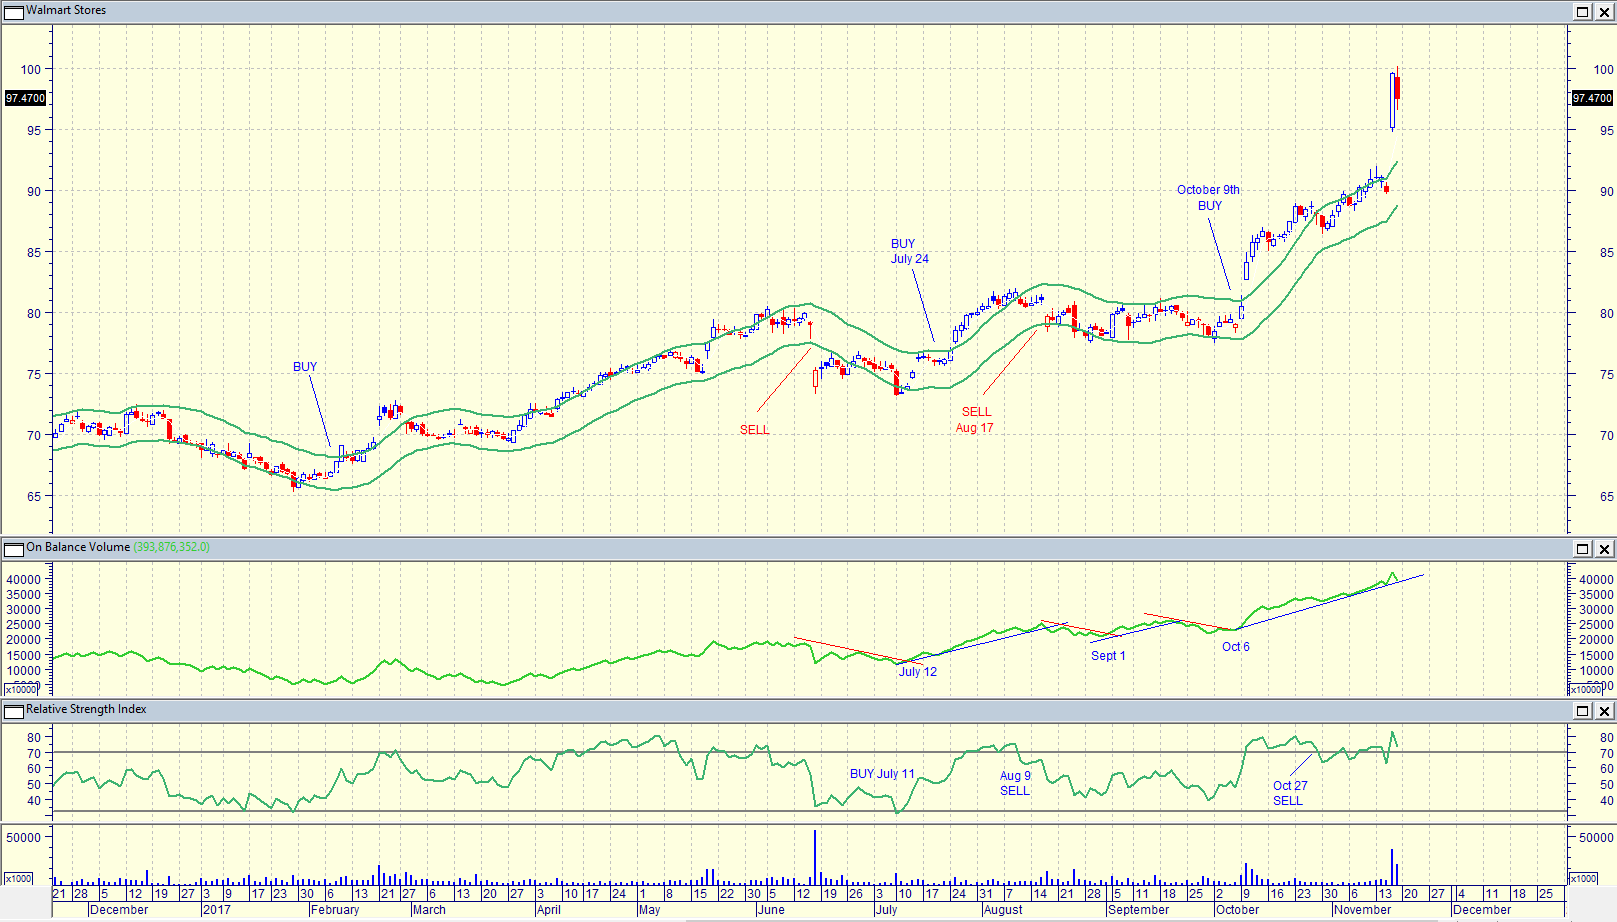
| Figure 1. Daily chart of Walmart. |
| Graphic provided by: MetaStock. |
| |
| In the chart of Figure 1, a chart of Walmart, note how the On Balance Volume indicator gave a buy signal on October 6. The Moving Average Band gave a Buy on October 9 but the RSI indicator was extremely early, suggesting a buy on July 11 with a sell on August 9 and not another buy even though the share price rose to new highs. Does one therefore use the RSI indicator to suggest buys and the OBV and Moving Average Band signals for sells? It sure looks like it. |

|
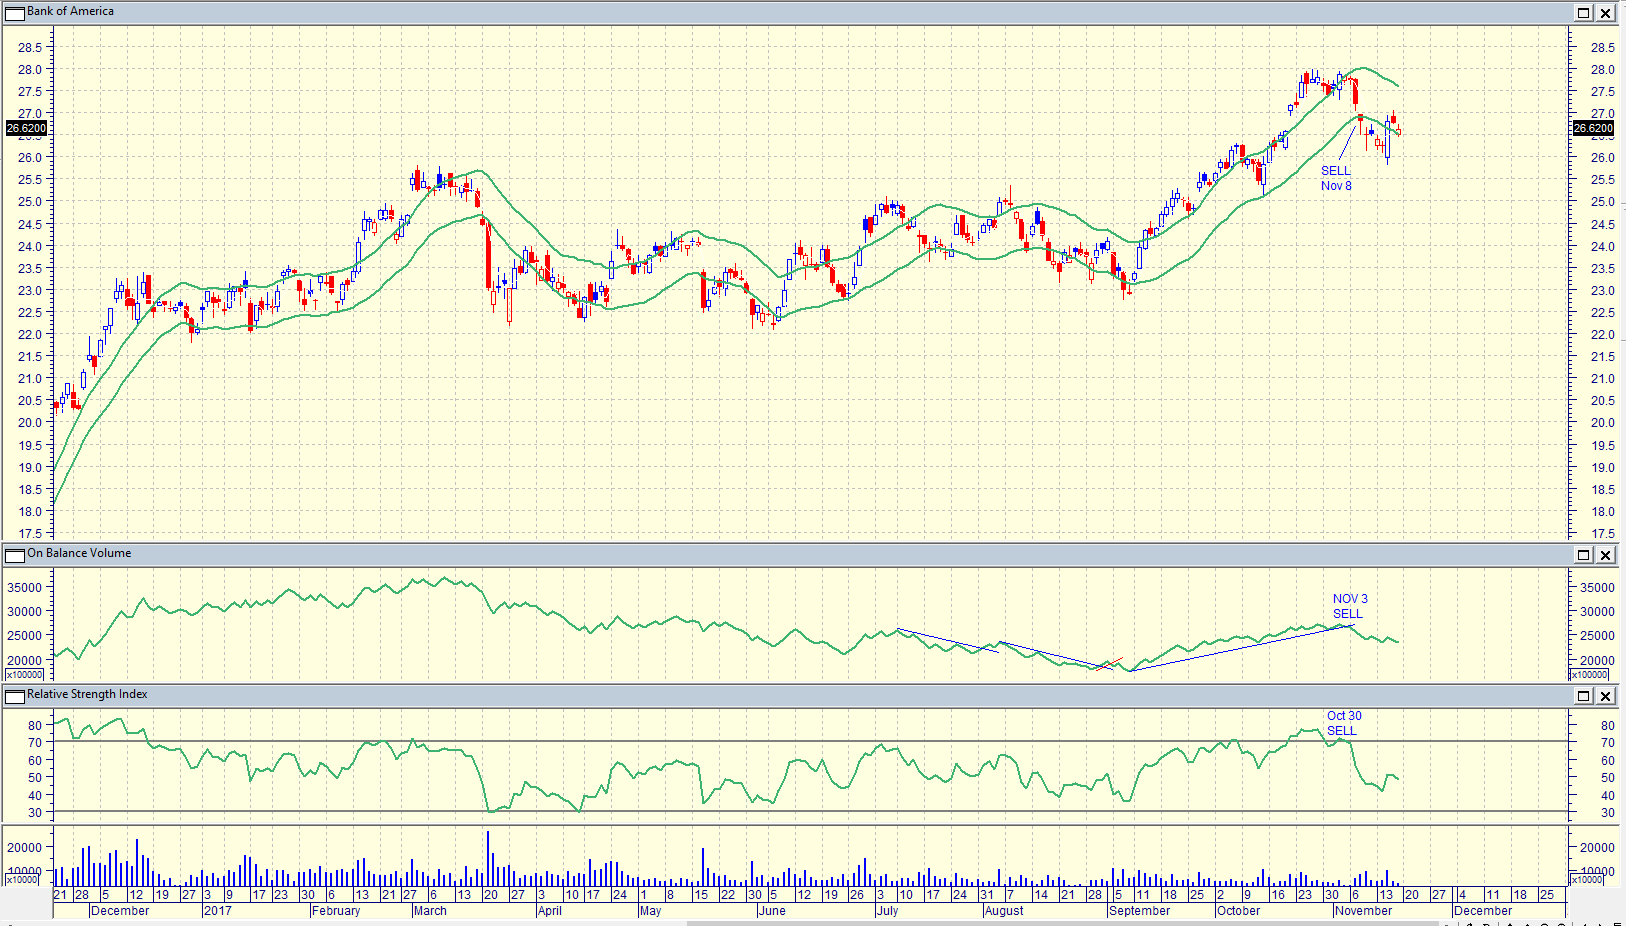
| Figure 2. Daily chart of Bank of America. |
| Graphic provided by: MetaStock. |
| |
| The chart in Figure 2 is a chart of Bank of America. Note how on November 8, the Moving Average Band gave a buy signal, whereas the OBV indicator gave a sell on November 3 and the RSI indicator gave a sell on October 30. In this chart, the RSI indicator was the best indicator to follow for sell signals. So, what is the best strategy to use? The answer of course is to test them all and look for the indicator or strategy that suits your trading personality. |
Has been a technical analyst since 1969, and has worked as a futures and options trader with First Financial Futures in Johannesburg, South Africa.
| Address: | 3256 West 24th Ave |
| Vancouver, BC | |
| Phone # for sales: | 6042634214 |
| E-mail address: | petroosp@gmail.com |
Click here for more information about our publications!
Comments
Date: 12/18/17Rank: 2Comment:

Request Information From Our Sponsors
- StockCharts.com, Inc.
- Candle Patterns
- Candlestick Charting Explained
- Intermarket Technical Analysis
- John Murphy on Chart Analysis
- John Murphy's Chart Pattern Recognition
- John Murphy's Market Message
- MurphyExplainsMarketAnalysis-Intermarket Analysis
- MurphyExplainsMarketAnalysis-Visual Analysis
- StockCharts.com
- Technical Analysis of the Financial Markets
- The Visual Investor
- VectorVest, Inc.
- Executive Premier Workshop
- One-Day Options Course
- OptionsPro
- Retirement Income Workshop
- Sure-Fire Trading Systems (VectorVest, Inc.)
- Trading as a Business Workshop
- VectorVest 7 EOD
- VectorVest 7 RealTime/IntraDay
- VectorVest AutoTester
- VectorVest Educational Services
- VectorVest OnLine
- VectorVest Options Analyzer
- VectorVest ProGraphics v6.0
- VectorVest ProTrader 7
- VectorVest RealTime Derby Tool
- VectorVest Simulator
- VectorVest Variator
- VectorVest Watchdog
