

HOT TOPICS LIST
- MACD
- Fibonacci
- RSI
- Gann
- ADXR
- Stochastics
- Volume
- Triangles
- Futures
- Cycles
- Volatility
- ZIGZAG
- MESA
- Retracement
- Aroon
INDICATORS LIST
LIST OF TOPICS
PRINT THIS ARTICLE
by Stella Osoba, CMT
Long upper candlestick tails and long lower candlestick tails should never be ignored because they are often telling you something about the likely future price behavior. Too often we look at a chart just to see if price is going up or down, but successful chart reading is about much more than that. It is about cultivating the ability to interpret what the candles are telling you about the likely future direction of price. Candlestick tails, also called shadows, will often provide a warning that is usually best heeded.
Position: N/A
Stella Osoba, CMT
Stella Osoba is a trader and financial writer. She is a frequent contributor to "Technical Analysis of Stocks and Commodities" magazine and "Traders.com Advantage" as well as other financial publications.
PRINT THIS ARTICLE
CANDLESTICK CHARTING
Watch Your Tails
12/01/17 04:42:14 PMby Stella Osoba, CMT
Long upper candlestick tails and long lower candlestick tails should never be ignored because they are often telling you something about the likely future price behavior. Too often we look at a chart just to see if price is going up or down, but successful chart reading is about much more than that. It is about cultivating the ability to interpret what the candles are telling you about the likely future direction of price. Candlestick tails, also called shadows, will often provide a warning that is usually best heeded.
Position: N/A
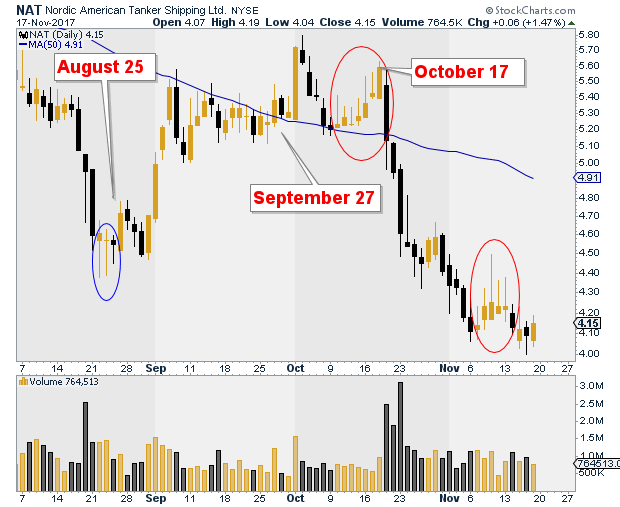
| Long upper tails mean that selling has caused price to move down from its high which is a bearish signal. Long lower tails usually meas that buying has caused price to move up from its low and is often bullish. Nordic American Tanker Shipping Ltd. (NAT) provides a good illustration why it is extremely useful to pay attention to tails when analyzing price action. |
| We can see by the blue circle on the chart that the a series of three long tailed candles marked a significant pause in what had been a severe downtrend. If all we were looking at was daily price action on August 24, the third day of the series of candles marked by the blue circle on the chart, we should have been alerted to pay attention as there was a definite change in price behavior. Selling had been halted, maybe temporarily, or maybe foreshadowing a trend change. It was much too soon to tell. But what price behavior was telling us was that buying was overcoming selling pressure. Maybe the bears were losing strength or standing to the side. Each time they pushed price down, bulls stepped in and bought, pushing up the price to close near its daily high. The strong bull candle on August 25 (the candle just outside the blue circle) was your signal that there was a definite change in the character of price action. |
|
| Figure 1. Daily chart for NAT. |
| Graphic provided by: StockCharts.com. |
| |
| Following the strong bull candle on August 25, there was a brief reaction marked by three consecutive bearish candles. It was important to note here that when this reaction was over it had made a higher low than the previous low, another bullish signal. NAT's next move was to the upside. It embarked on a strong move up which took price to just below the 50-day moving average before the move ran out of steam. NAT then moved sideways for almost three weeks, with the stock repeatedly finding resistance below the 50-day moving average. The breakout happened on September 27, 2017 and three days later, a very strong bull candle took price up to a high of 5.73. The temptation would be to enter a long trade or add to positions after such an overwhelmingly strong move. But look at what happens next. The stock reacts and price retreats back down to the 50-day moving average. This is not a good move, but at this point we are not sure if it is just a reaction in the new trend. The next six days of price action (first red circle) indicate a more ominous interpretation. Those six days are all bullish candles with closes above the 50-day moving average. But each one of those candles has a long upper tail, which is bearish. Bulls are pushing the stock up, but selling pressure is coming in to move the stock back down. |
| On October 18, 2017 a strong bull candle develops which is a last chance for bulls to exit the trade before the steep price plunge. The second red circle on the chart shows a pause delineating the first stage of the plunge. The first in this series of candles forms an inside day with the prior candle. The next few candles are bullish candles with bearish overtones, once again the long upper tails are telling us that selling has not been completed. We know this before price action once again breaks to the downside. The above analysis is for educational purposes only. |
Stella Osoba is a trader and financial writer. She is a frequent contributor to "Technical Analysis of Stocks and Commodities" magazine and "Traders.com Advantage" as well as other financial publications.
| E-mail address: | stellaosoba@gmail.com |
Click here for more information about our publications!
PRINT THIS ARTICLE

Request Information From Our Sponsors
- StockCharts.com, Inc.
- Candle Patterns
- Candlestick Charting Explained
- Intermarket Technical Analysis
- John Murphy on Chart Analysis
- John Murphy's Chart Pattern Recognition
- John Murphy's Market Message
- MurphyExplainsMarketAnalysis-Intermarket Analysis
- MurphyExplainsMarketAnalysis-Visual Analysis
- StockCharts.com
- Technical Analysis of the Financial Markets
- The Visual Investor
- VectorVest, Inc.
- Executive Premier Workshop
- One-Day Options Course
- OptionsPro
- Retirement Income Workshop
- Sure-Fire Trading Systems (VectorVest, Inc.)
- Trading as a Business Workshop
- VectorVest 7 EOD
- VectorVest 7 RealTime/IntraDay
- VectorVest AutoTester
- VectorVest Educational Services
- VectorVest OnLine
- VectorVest Options Analyzer
- VectorVest ProGraphics v6.0
- VectorVest ProTrader 7
- VectorVest RealTime Derby Tool
- VectorVest Simulator
- VectorVest Variator
- VectorVest Watchdog