HOT TOPICS LIST
- MACD
- Fibonacci
- RSI
- Gann
- ADXR
- Stochastics
- Volume
- Triangles
- Futures
- Cycles
- Volatility
- ZIGZAG
- MESA
- Retracement
- Aroon
INDICATORS LIST
LIST OF TOPICS
PRINT THIS ARTICLE
by Gary Grosschadl
Gold has made a bullish move the past week. It's time to consider what the longer term charts are saying.
Position: N/A
Gary Grosschadl
Independent Canadian equities trader and technical analyst based in Peterborough
Ontario, Canada.
PRINT THIS ARTICLE
CHART ANALYSIS
The Glitter Of Gold
12/10/02 11:19:13 AMby Gary Grosschadl
Gold has made a bullish move the past week. It's time to consider what the longer term charts are saying.
Position: N/A
| In my previous analysis of the daily XAU gold index (Gold Index Looks Rangebound, Waiting For Triangle Break), I discussed the prudence of waiting for a trendline touch (from the 6-month symmetrical triangle) to produce a more tradeable move. Well that certainly was the case as gold bounced from the lower trendline to the upper trendline in six trading days. Now that the index has broken through the triangle to the upside it is starting to look a little toppy, so taking a look at the longer term charts for gold futures may help in determining an upcoming strategy. |
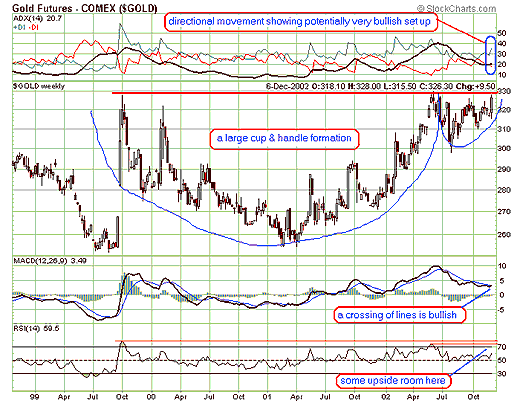
| The rise in the gold index and related stocks were driven by the price of gold as it rose from $316 to a high of 328 before closing at 326.30 for the week. Taking a look at the weekly chart of gold futures, a potentially very bullish pattern has materialized. A cup and handle formation is outlined with a "neckline" or resistance at around $330. This bullish pattern, when it works to the upside, can result in a strong breakout move. Likewise failure here could bring a sudden decline as those caught going the wrong way quickly bail. What does indicator analysis reveal? The three displayed indicators seem to point to a reasonable chance of more upside coming. The directional movement trend indicator (ADX/DI) looks like a strong move is starting. The ideal setup is occurring as +DI is over -DI (showing bullish power) and the ADX line has moved in between and is starting to upslope. If the ADX continues to climb above 20, it points to a strong directional move developing. The MACD (moving average convergence/divergence) appears to be on the verge of a bullish crossover but we have to make sure it does not stall here. The other indicator I found to be noteworthy is the RSI (relative strength index) - a momentum oscillator that compares the magnitude of gains against the magnitude of losses. This indicator shows more potential room to the upside before overbought conditions (above 70) normally apply. For these reasons, this weekly chart can be bullishly viewed. |

|
| Figure 1: $GOLD weekly chart. |
| Graphic provided by: StockCharts.com. |
| |
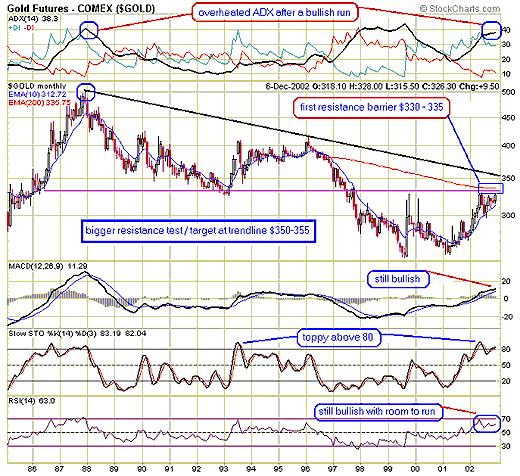
Now we look at the monthly gold chart for another view. This longer term chart does a good job of showing what challenges lie ahead for this gold move. Note the long-term resistance line forming around $330 with additional resistance from the 200-period exponential moving average (EMA). This suggests a hefty layer of resistance to overcome in the 330-335 area. The directional movement indicator ADX/DI shows the ADX in overheated territory as it is above both DIs. Since it is still upsloping, it can conceiveably run higher but it should soon peak as well. Once the ADX declines from here, things can quickly turn ugly as they have in a similar instance shown on the chart. The stochastics oscillator also shows the potential toppiness here with a value over 80. The other two displayed indicators show the mixed picture here with both still being in bullish mode with more potential upside room. Figure 2: $GOLD monthly chart. |
| Of particular importance is the 15-year trendline at $355. This very likely is powerful resistance. What is left off the chart for the purpose of visual clarity is the 200-period simple moving average. Similar to the exponential moving average, it can vary over time as it is not as forward-weighted as its brother, EMA. The 200-period moving average actually lies at the $355 vicinity, the same as the trendline. This says to me that this trendline resistance has even more reason to limit any bullish assault against it. One likely bullish scenario then is the possiblity of a bullish spike up to this area of $350 - 360. The danger then could be a sudden reversal, catching any latecomers to the gold party holding the proverbial bag. |
| What conclusions can be drawn from the above charts? As always we are dealing in possibilities and probabilities and nothing is a sure thing. I am leaning towards a possible war-driven scenario resulting in a brief spike up in gold price and related gold stocks. If this occurs, the question of course is how high and how long. Should resistance at $335 be overcome, the $350ish zone is likely a good trading target. A good place to dance close to the exits, should I prove to be correct. |
Independent Canadian equities trader and technical analyst based in Peterborough
Ontario, Canada.
| Website: | www.whatsonsale.ca/financial.html |
| E-mail address: | gwg7@sympatico.ca |
Click here for more information about our publications!
Comments
Date: 12/11/02Rank: 5Comment:
Date: 12/13/02Rank: 4Comment:
Date: 12/17/02Rank: 4Comment:

|

Request Information From Our Sponsors
- VectorVest, Inc.
- Executive Premier Workshop
- One-Day Options Course
- OptionsPro
- Retirement Income Workshop
- Sure-Fire Trading Systems (VectorVest, Inc.)
- Trading as a Business Workshop
- VectorVest 7 EOD
- VectorVest 7 RealTime/IntraDay
- VectorVest AutoTester
- VectorVest Educational Services
- VectorVest OnLine
- VectorVest Options Analyzer
- VectorVest ProGraphics v6.0
- VectorVest ProTrader 7
- VectorVest RealTime Derby Tool
- VectorVest Simulator
- VectorVest Variator
- VectorVest Watchdog
- StockCharts.com, Inc.
- Candle Patterns
- Candlestick Charting Explained
- Intermarket Technical Analysis
- John Murphy on Chart Analysis
- John Murphy's Chart Pattern Recognition
- John Murphy's Market Message
- MurphyExplainsMarketAnalysis-Intermarket Analysis
- MurphyExplainsMarketAnalysis-Visual Analysis
- StockCharts.com
- Technical Analysis of the Financial Markets
- The Visual Investor
