HOT TOPICS LIST
- MACD
- Fibonacci
- RSI
- Gann
- ADXR
- Stochastics
- Volume
- Triangles
- Futures
- Cycles
- Volatility
- ZIGZAG
- MESA
- Retracement
- Aroon
INDICATORS LIST
LIST OF TOPICS
PRINT THIS ARTICLE
by Koos van der Merwe
Gold is regarded as a safe haven in times of an uncertain market, but when a strong sale occurs out of the blue?
Position: Sell
Koos van der Merwe
Has been a technical analyst since 1969, and has worked as a futures and options trader with First Financial Futures in Johannesburg, South Africa.
PRINT THIS ARTICLE
TECHNICAL ANALYSIS
Gold - An Unexpected Sale
12/01/17 04:05:20 PMby Koos van der Merwe
Gold is regarded as a safe haven in times of an uncertain market, but when a strong sale occurs out of the blue?
Position: Sell
| On Friday, November 10, a large sell order of Gold futures hit the futures market, knocking the yellow metal. Someone sold 30,000 contracts ($4.2 billion notional) in just 1 minute. The question is who sold and why? Gold was gathering support from a modest pullback in the US$ and stocks that were starting to weaken. Doubts as to whether the tax reform legislation currently in the Senate and Congress will pass, is on everyone's mind. Should President Trump be unable to achieve any significant legislation in his first year of office, it would be very negative for his Presidency. With recent political loss in state elections by the Republican party, Republican congressional majorities could be in jeopardy in 2018, causing the US stock market to be vulnerable to a serious correction. Safe-haven assets like gold should, by all accounts, come back in favor. Why then the recent strong sale of Gold? One can only assume that cash could be king. |

|
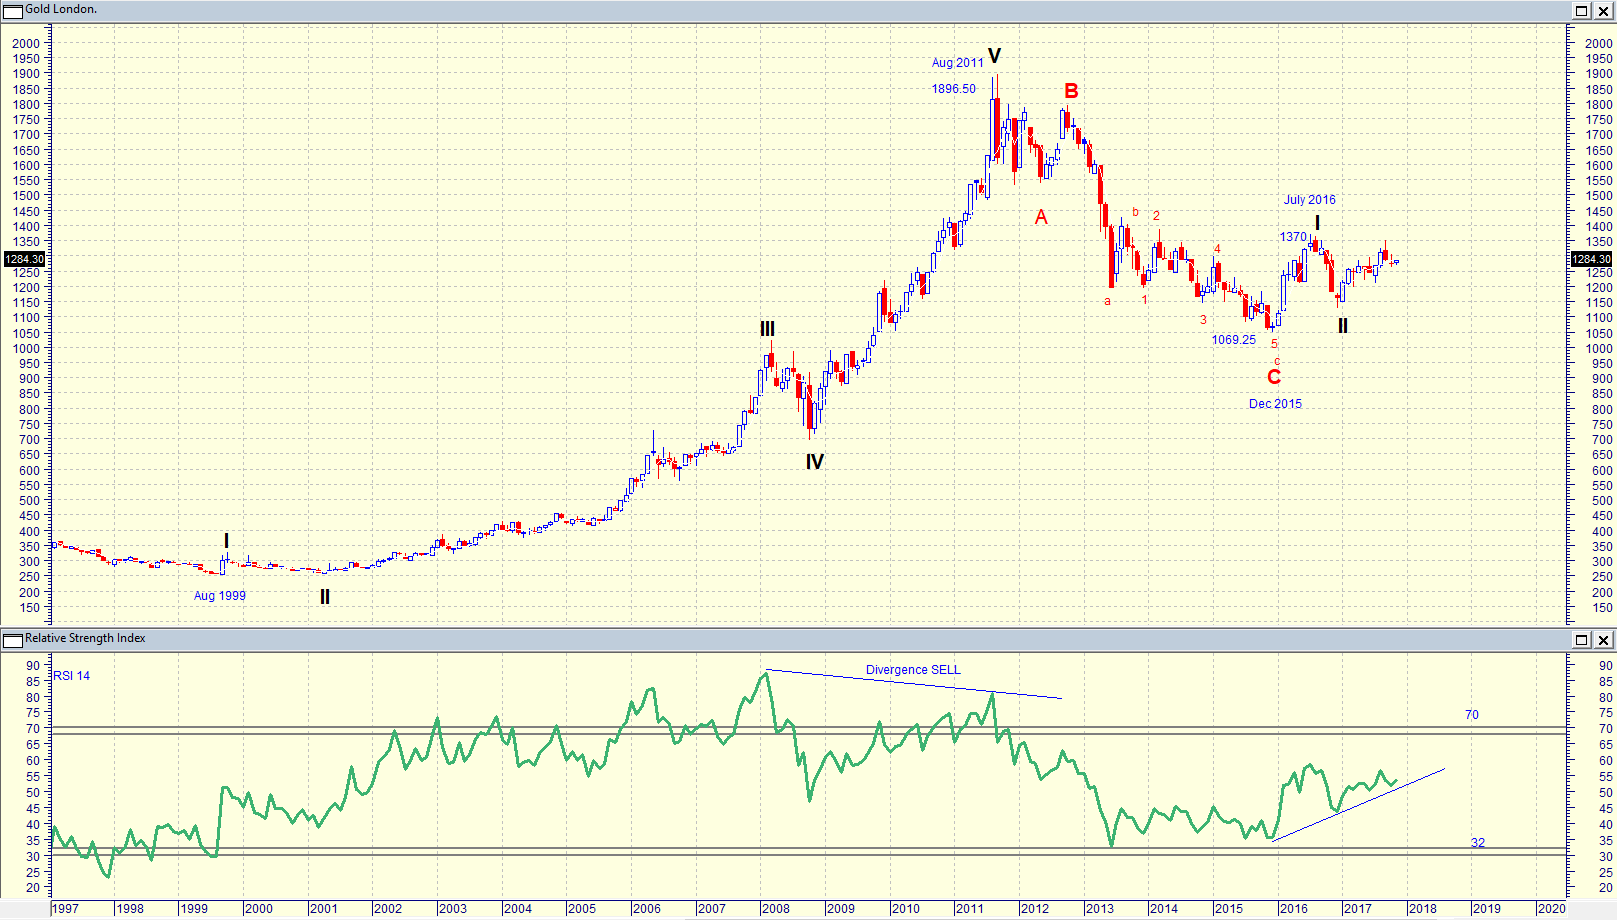
| Figure 1. Monthly chart of the Gold price. |
| Graphic provided by: MetaStock. |
| |
| The chart in Figure 1 is a chart of the Gold price suggesting that the price is rising in a WAVE III. The RSI Indicator shown on the chart is also suggesting strength. |

|
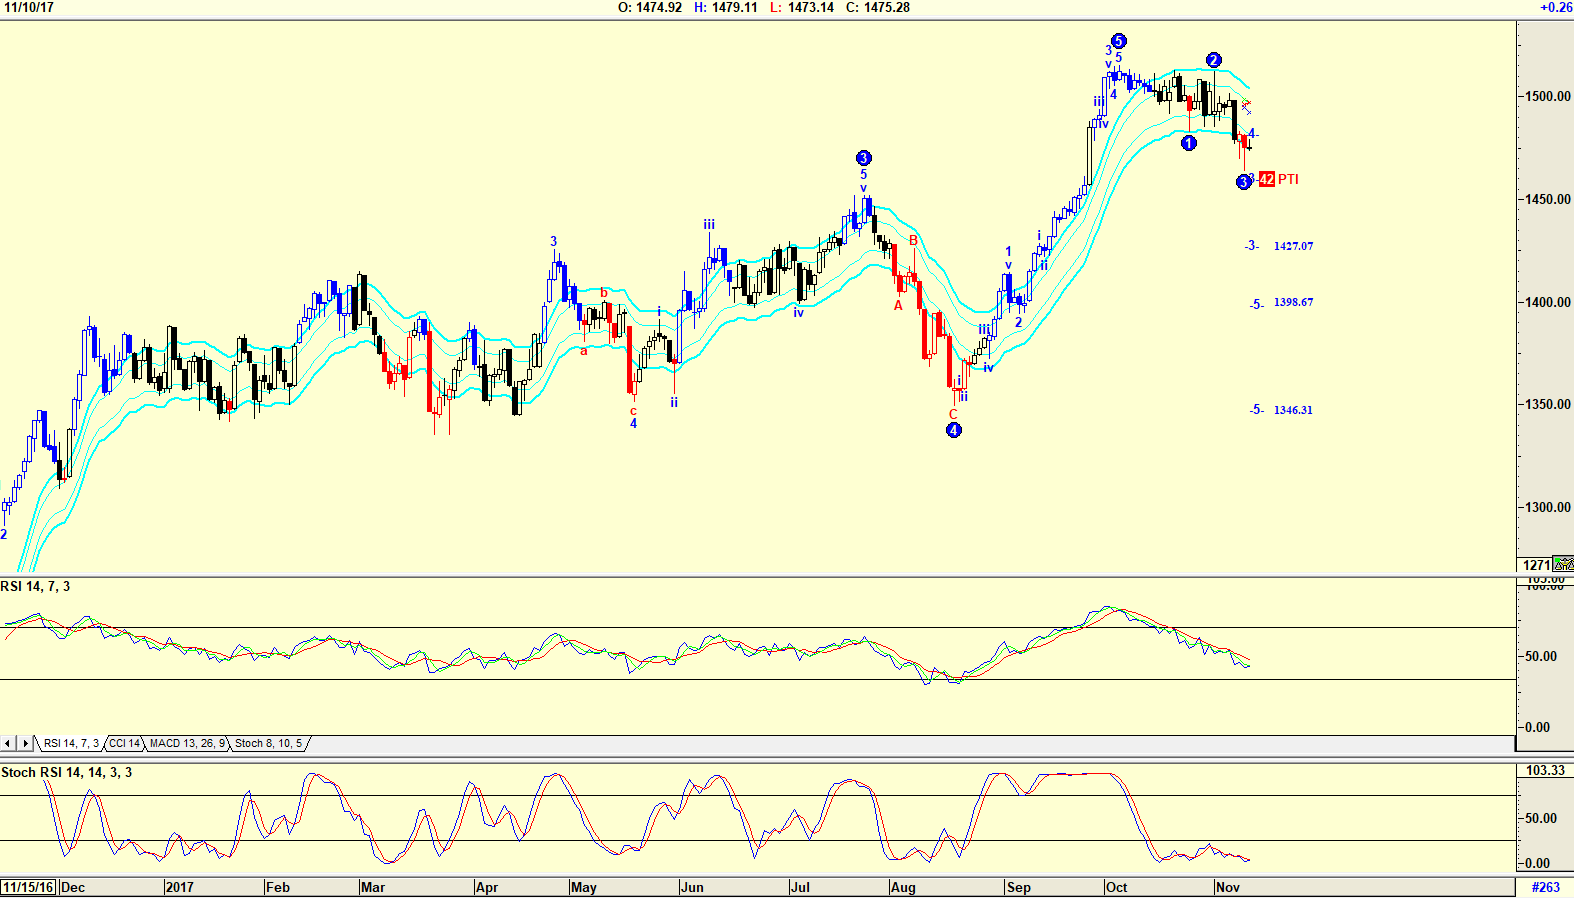
| Figure 2. Daily chart of the Russell 2000 Index. |
| Graphic provided by: AdvancedGET. |
| |
| The chart in Figure 2 is a daily chart of the Russell 2000 Index. The chart suggests an Elliott Wave correction to either 1427.07, 1398.67 or 1346.31. The PTI (Probability Index) shown on the chart is 42 — rather low, but nevertheless a possibility. The RSI Index is suggesting further weakness although the Stochastic RSI indicator is at overbought levels, but has not yet given a buy. |

|
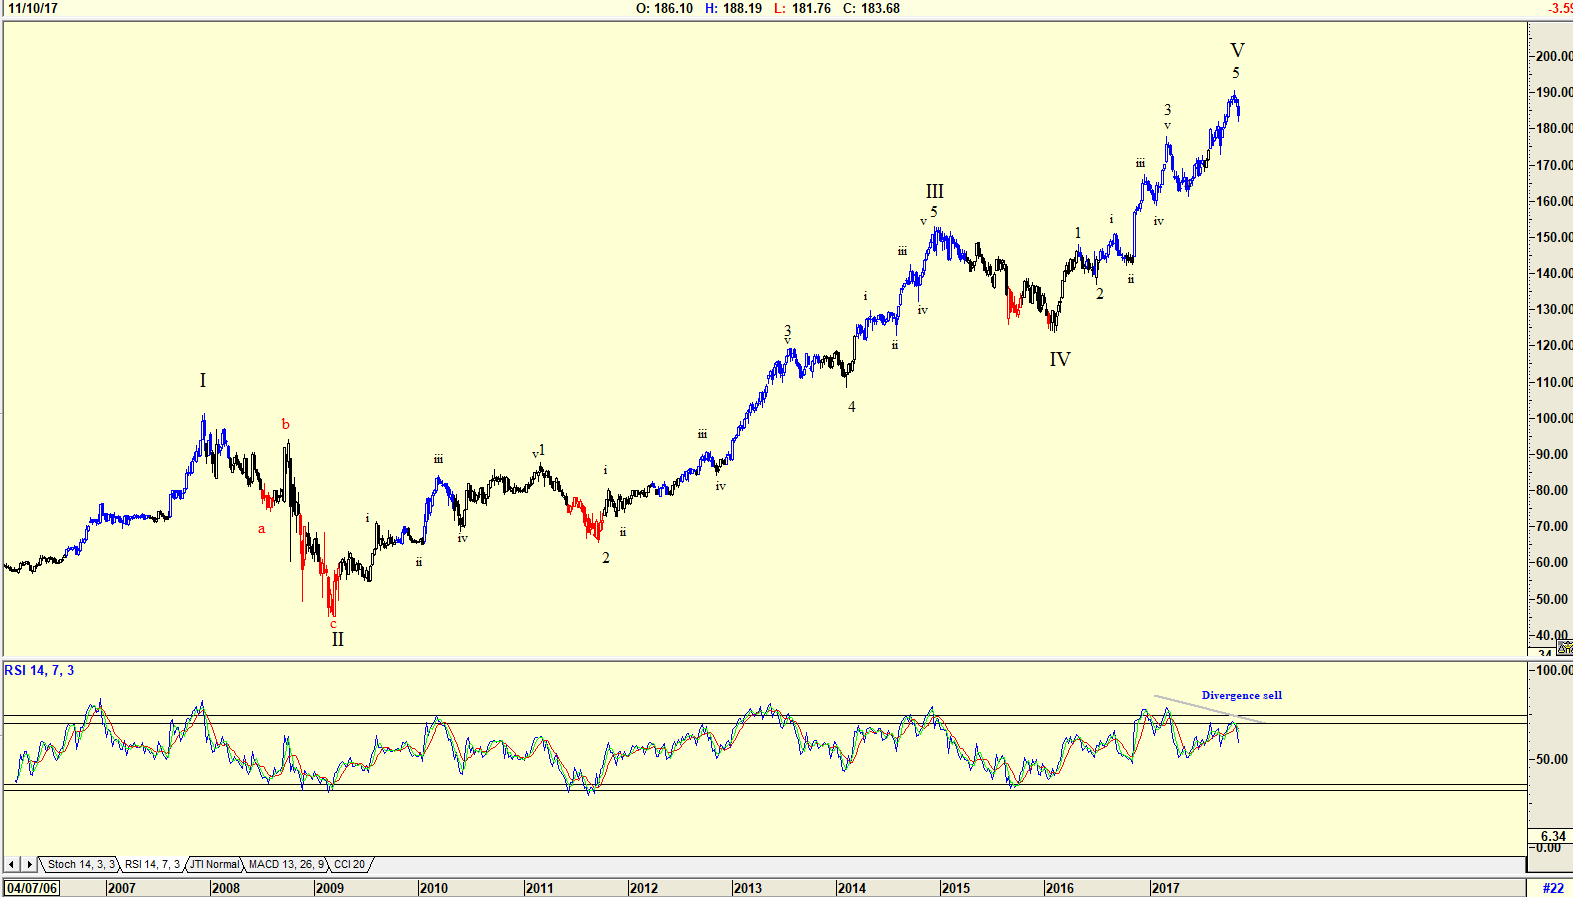
| Figure 3. Daily chart of Berkshire Hathaway B Shares. |
| Graphic provided by: AdvancedGET. |
| |
| The chart in Figure 3 is a weekly chart of Berkshire Hathaway B shares. Warren Buffet, the CEO of Berkshire Hathaway, is known for being an expert at predicting where the stock market is headed. The chart suggests that a WAVE V has been completed, and that the share price could now correct in an ABC correction. The RSI indicator shown has given a divergence sell signal. A divergence sell is where the share price rises but the RSI indicator makes lower highs. It is known to be a strong signal. Yes, the world is becoming a dangerous place. What with the nonsense of North Korea; the recent Yemen rocket launch into Saudi Arabia that was prevented and with Iran becoming more and more active. With the political investigation of Russian influence in the American political scenario, who knows what lies just around the corner. So, is cash, not gold, king? |
Has been a technical analyst since 1969, and has worked as a futures and options trader with First Financial Futures in Johannesburg, South Africa.
| Address: | 3256 West 24th Ave |
| Vancouver, BC | |
| Phone # for sales: | 6042634214 |
| E-mail address: | petroosp@gmail.com |
Click here for more information about our publications!
PRINT THIS ARTICLE

Request Information From Our Sponsors
- StockCharts.com, Inc.
- Candle Patterns
- Candlestick Charting Explained
- Intermarket Technical Analysis
- John Murphy on Chart Analysis
- John Murphy's Chart Pattern Recognition
- John Murphy's Market Message
- MurphyExplainsMarketAnalysis-Intermarket Analysis
- MurphyExplainsMarketAnalysis-Visual Analysis
- StockCharts.com
- Technical Analysis of the Financial Markets
- The Visual Investor
- VectorVest, Inc.
- Executive Premier Workshop
- One-Day Options Course
- OptionsPro
- Retirement Income Workshop
- Sure-Fire Trading Systems (VectorVest, Inc.)
- Trading as a Business Workshop
- VectorVest 7 EOD
- VectorVest 7 RealTime/IntraDay
- VectorVest AutoTester
- VectorVest Educational Services
- VectorVest OnLine
- VectorVest Options Analyzer
- VectorVest ProGraphics v6.0
- VectorVest ProTrader 7
- VectorVest RealTime Derby Tool
- VectorVest Simulator
- VectorVest Variator
- VectorVest Watchdog
