HOT TOPICS LIST
- MACD
- Fibonacci
- RSI
- Gann
- ADXR
- Stochastics
- Volume
- Triangles
- Futures
- Cycles
- Volatility
- ZIGZAG
- MESA
- Retracement
- Aroon
INDICATORS LIST
LIST OF TOPICS
PRINT THIS ARTICLE
by Koos van der Merwe
On September 12, Tim Cook, Apple CEO, announced the iPhone X. Is it time to buy Apple shares?
Position: Buy
Koos van der Merwe
Has been a technical analyst since 1969, and has worked as a futures and options trader with First Financial Futures in Johannesburg, South Africa.
PRINT THIS ARTICLE
TECHNICAL ANALYSIS
Apple and IPhone X
11/22/17 03:00:14 PMby Koos van der Merwe
On September 12, Tim Cook, Apple CEO, announced the iPhone X. Is it time to buy Apple shares?
Position: Buy
| "The iPhone X is the iPhone we have been waiting for." So said Tim Cook when he announced that a new Apple iPhone will be released that will shake the market. On Friday, October 27, Apple was accepting orders ahead of the November 3 release date. The iPhone lived up to its hype with pre-order demand that was "off the charts." So, with the expected sale of the iPhone above expectations, is it time to buy the share? |

|
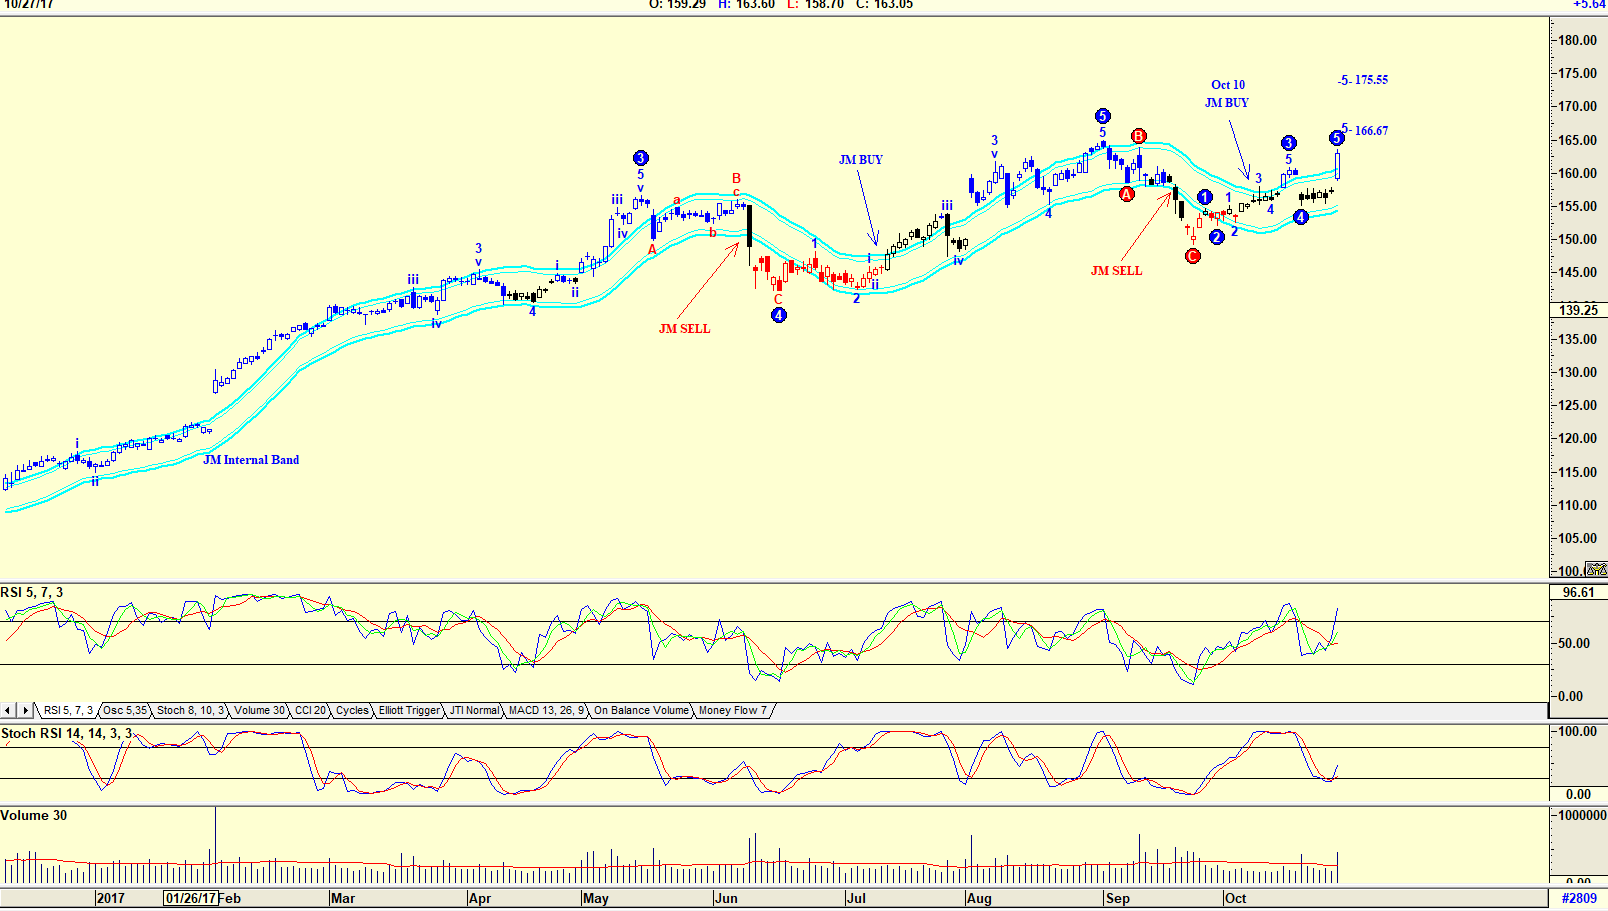
| Figure 1. Daily chart of AAPL. |
| Graphic provided by: AdvancedGET. |
| |
| The chart in Figure 1 is a daily chart showing that the share price of Apple gave a buy signal on October 10. A JM Internal band is a 15-period simple moving average offset by 2% positive and 2% negative. A move above the upper band is a buy signal, and below the lower band a sell signal. On October 10, the share price gave a buy signal, and on October 27, when pre-orders began for the new Apple phone, the share price shot up strongly. The RSI indicator shown on the chart is at overbought levels, but the Stochastic RSI indicator has given a new buy. Volume also rose as the share price rose suggesting strength. Elliott wave count suggests a 5th wave rise to either $166.67 or $175.55. |

|
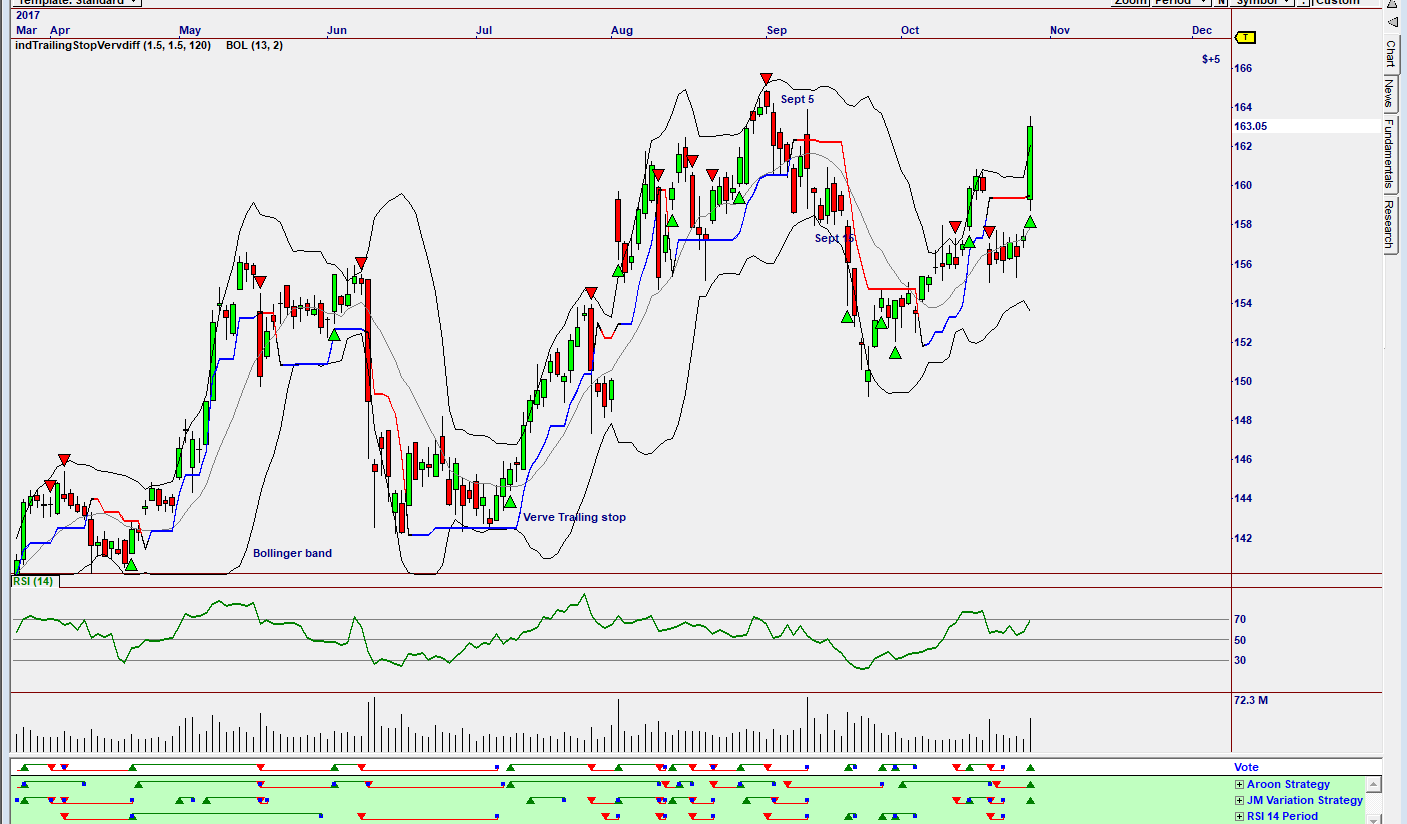
| Figure 2. Daily Omnitrader chart for AAPL |
| Graphic provided by: Omnitrader. |
| |
| Looking at an Omnitrader chart shown in Figure 2, one can see that a buy signal has been given on the Vote line based on the Aroon and JM Variation Strategies shown in green below the Vote line. The chart shows that the share price is testing the upper Bollinger band, and the RSI indicator is at overbought levels and suggesting a sell. So, the question is, do you buy Apple shares now? The chart in Figure 1 and Figure 2 suggests that the share could be a short-term buy. The only problem is that the indicators are suggesting a sell. So, if you do decide to buy the share, keep your stop loss close to your chest. |
Has been a technical analyst since 1969, and has worked as a futures and options trader with First Financial Futures in Johannesburg, South Africa.
| Address: | 3256 West 24th Ave |
| Vancouver, BC | |
| Phone # for sales: | 6042634214 |
| E-mail address: | petroosp@gmail.com |
Click here for more information about our publications!
PRINT THIS ARTICLE

Request Information From Our Sponsors
- StockCharts.com, Inc.
- Candle Patterns
- Candlestick Charting Explained
- Intermarket Technical Analysis
- John Murphy on Chart Analysis
- John Murphy's Chart Pattern Recognition
- John Murphy's Market Message
- MurphyExplainsMarketAnalysis-Intermarket Analysis
- MurphyExplainsMarketAnalysis-Visual Analysis
- StockCharts.com
- Technical Analysis of the Financial Markets
- The Visual Investor
- VectorVest, Inc.
- Executive Premier Workshop
- One-Day Options Course
- OptionsPro
- Retirement Income Workshop
- Sure-Fire Trading Systems (VectorVest, Inc.)
- Trading as a Business Workshop
- VectorVest 7 EOD
- VectorVest 7 RealTime/IntraDay
- VectorVest AutoTester
- VectorVest Educational Services
- VectorVest OnLine
- VectorVest Options Analyzer
- VectorVest ProGraphics v6.0
- VectorVest ProTrader 7
- VectorVest RealTime Derby Tool
- VectorVest Simulator
- VectorVest Variator
- VectorVest Watchdog
