

HOT TOPICS LIST
- MACD
- Fibonacci
- RSI
- Gann
- ADXR
- Stochastics
- Volume
- Triangles
- Futures
- Cycles
- Volatility
- ZIGZAG
- MESA
- Retracement
- Aroon
INDICATORS LIST
LIST OF TOPICS
PRINT THIS ARTICLE
by Stella Osoba, CMT
Traders often use momentum indicators like the Moving Average Convergence Divergence (MACD) to spot negative and positive divergences with price. This article will discuss why divergences do not always work.
Position: N/A
Stella Osoba, CMT
Stella Osoba is a trader and financial writer. She is a frequent contributor to "Technical Analysis of Stocks and Commodities" magazine and "Traders.com Advantage" as well as other financial publications.
PRINT THIS ARTICLE
TECHNICAL ANALYSIS
A Warning About Divergencies
11/10/17 11:41:20 AMby Stella Osoba, CMT
Traders often use momentum indicators like the Moving Average Convergence Divergence (MACD) to spot negative and positive divergences with price. This article will discuss why divergences do not always work.
Position: N/A
| A positive divergence happens when price makes a lower low, but the MACD forms a higher low. A negative divergence happens when price forms a higher high, but the MACD forms a lower high. In each instance, for a divergence to occur, the momentum indicator needs to diverge from price action. |
| What does a momentum indicator measure? The speed of price action. So think of it like this; if price forms a higher high, but the indicator does not, that simply means that price ascent has slowed. Price moved much faster during the formation of the previous high, than it did during the formation of the current high. The same rationale can be used in situations when price forms a lower low but the indicator forms a higher low. The indicator is telling us that the rate of price decline has slowed. |
| While it is true that the rate of price decline or ascent can tell us something about the future direction of price, this is not always the case. The following example of Boeing Co. (BA) will help us illustrate some pitfalls of this very important concept. |
|
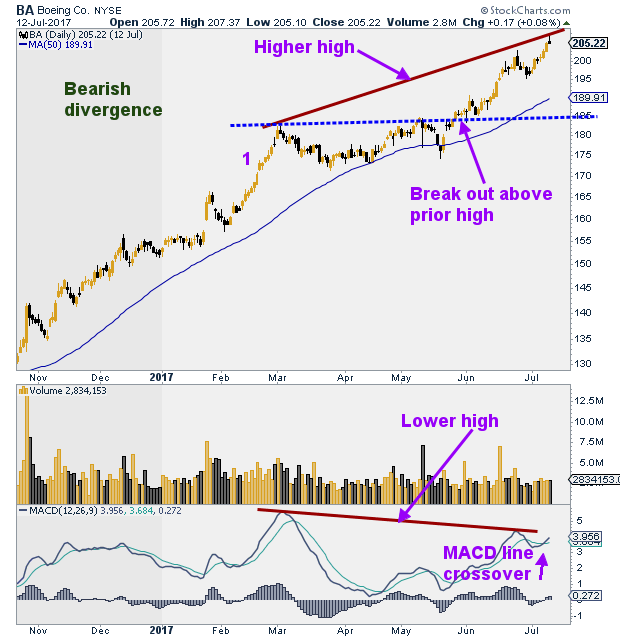
| Figure 1. Daily chart for BA. |
| Graphic provided by: StockCharts.com. |
| |
| In March 2017, when BA reached a new high of 183.21 (see Figure 1), it had already been in a strong uptrend since October, 2016 (not shown), when it had broken out of a trading range. The leg up after the reaction (see 1 on Figure 1) was extremely strong and took the stock up to 183.21 to form a new high. We have only to look at the chart to see that when price next broke above the high formed on February 6, the ensuing move up was not as strong as the earlier move, the rate of ascent had slowed. Nevertheless price continued its uptrend. The MACD recorded the slower speed of the second peak which caused a negative divergence to form as we can see from the chart. |
| Why this signal should have been ignored. BA was still obviously in a strong uptrend with price making new highs. The 50-day moving average was still turning up. Price was above its average and the MACD was in positive territory. The MACD line had also crossed above the signal line. Everything about the chart was bullish. One approach to take to avoid being confused is to weigh all the evidence before you and decide whether the majority of signals are bullish or bearish. In this case, as I have noted above, most of the signals were bullish. So taking the long trade would have been wise. But as always, a note of caution. Technical analysis never gives us certainties. Anything can, and will often happen in the markets, so vigilance and the correct use of stops is always essential. |
Stella Osoba is a trader and financial writer. She is a frequent contributor to "Technical Analysis of Stocks and Commodities" magazine and "Traders.com Advantage" as well as other financial publications.
| E-mail address: | stellaosoba@gmail.com |
Click here for more information about our publications!
Comments
Date:�12/18/17Rank:�3Comment:�

Request Information From Our Sponsors
- StockCharts.com, Inc.
- Candle Patterns
- Candlestick Charting Explained
- Intermarket Technical Analysis
- John Murphy on Chart Analysis
- John Murphy's Chart Pattern Recognition
- John Murphy's Market Message
- MurphyExplainsMarketAnalysis-Intermarket Analysis
- MurphyExplainsMarketAnalysis-Visual Analysis
- StockCharts.com
- Technical Analysis of the Financial Markets
- The Visual Investor
- VectorVest, Inc.
- Executive Premier Workshop
- One-Day Options Course
- OptionsPro
- Retirement Income Workshop
- Sure-Fire Trading Systems (VectorVest, Inc.)
- Trading as a Business Workshop
- VectorVest 7 EOD
- VectorVest 7 RealTime/IntraDay
- VectorVest AutoTester
- VectorVest Educational Services
- VectorVest OnLine
- VectorVest Options Analyzer
- VectorVest ProGraphics v6.0
- VectorVest ProTrader 7
- VectorVest RealTime Derby Tool
- VectorVest Simulator
- VectorVest Variator
- VectorVest Watchdog