HOT TOPICS LIST
- MACD
- Fibonacci
- RSI
- Gann
- ADXR
- Stochastics
- Volume
- Triangles
- Futures
- Cycles
- Volatility
- ZIGZAG
- MESA
- Retracement
- Aroon
INDICATORS LIST
LIST OF TOPICS
PRINT THIS ARTICLE
by Koos van der Merwe
Canada legalized medical marijuana in 2001. The industry has since evolved much more.
Position: Accumulate
Koos van der Merwe
Has been a technical analyst since 1969, and has worked as a futures and options trader with First Financial Futures in Johannesburg, South Africa.
PRINT THIS ARTICLE
TECHNICAL ANALYSIS
Marijuana Stocks To Look At
11/03/17 04:43:23 PMby Koos van der Merwe
Canada legalized medical marijuana in 2001. The industry has since evolved much more.
Position: Accumulate
| Unlike America where marijuana is not legalized for medical use, the marijuana industry has evolved to the extent where in November 2016, the Canadian government came out with recommendations for changing the current regulations and paving the way for the legalization of pot for recreational purposes, as well. In the United States, currently only 8 states have legalized marijuana for recreational use. While uncertainty prevails in the US, investors could invest in Canadian stocks to get a piece of the action. Below are four stocks one can look at. |

|
| Figure 1. ABBVIE, Inc. |
| Graphic provided by: AdvancedGET. |
| |
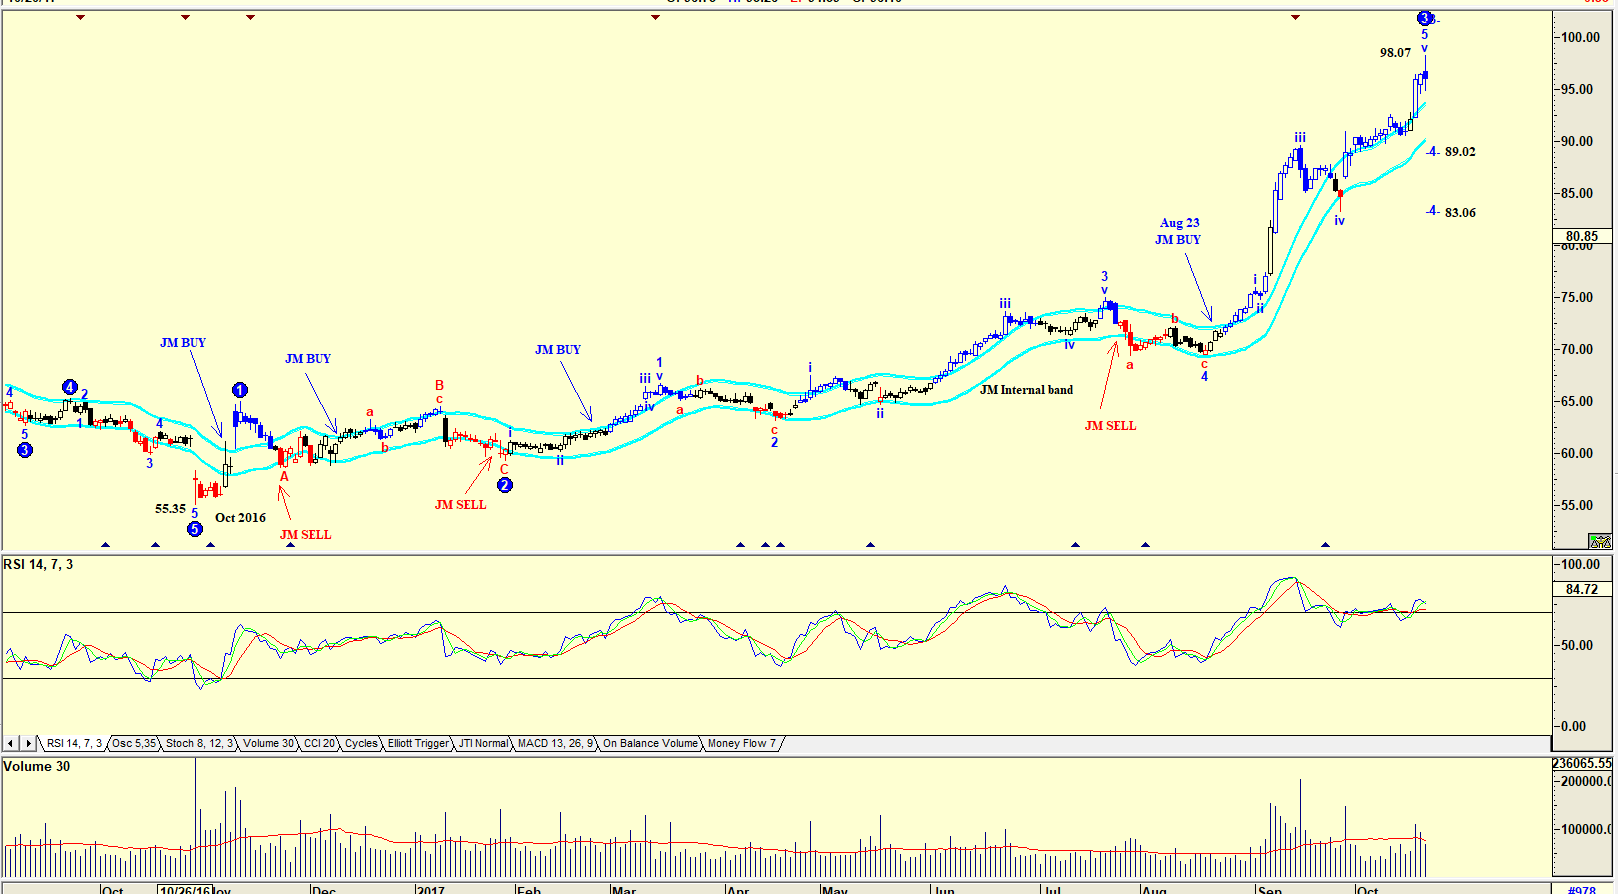
| The stock in Figure 1 is a daily chart of ABBVIE, Inc. listed on the US market as ABBV. The chart shows how the price rose from a low of $55.35 in October 2016 to its present high of $98.07. The Elliott wave count is suggesting that the share price is in a WAVE 3 and could correct in a WAVE 4 to either 89.02 or 83.06. The RSI indicator is at overbought levels, and volume has fallen recently as the share price rose, suggesting weakness ahead. The chart shows a JM Buy given on August 23. The JM Internal Band is a simple 15-period moving average offset by 2% plus and 2% negative. A move above the upper band suggests a buy as shown on the chart, and below the lower band a sell. |

|
| Figure 2. Aphria, Inc. |
| Graphic provided by: AdvancedGET. |
| |
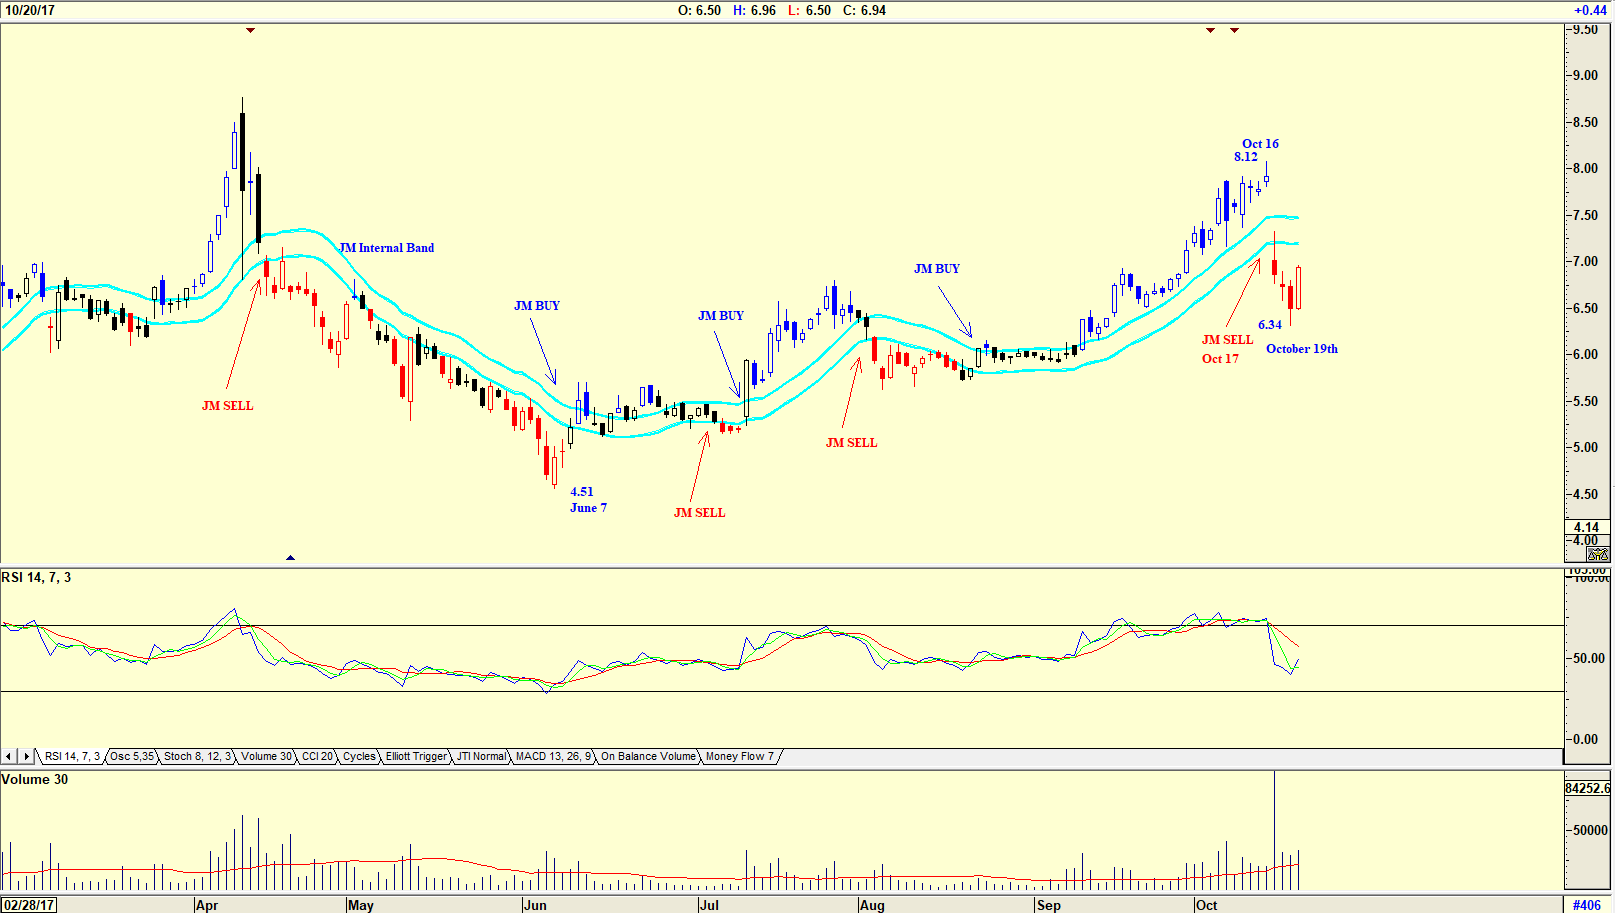
| The chart in Figure 2 is a chart of APHRIA, Inc. (APH-T). The share price is not as expensive as that of ABBVIE, Inc., and is trading on the Canadian stock market. The chart shows how the share price moved from a low of $4.51 on June 7, 2017 to a high of $8.12 by October 16. The share price fell to a low of $6.34 by October 19 but has since risen to its present price of $6.34. The JM Internal Band gave a sell signal on October 17. One should keep the share on a watch list, and when it breaks above the upper band, suggesting a buy, one could buy the share. |

|
| Figure 3. Aurora. |
| Graphic provided by: AdvancedGET. |
| |
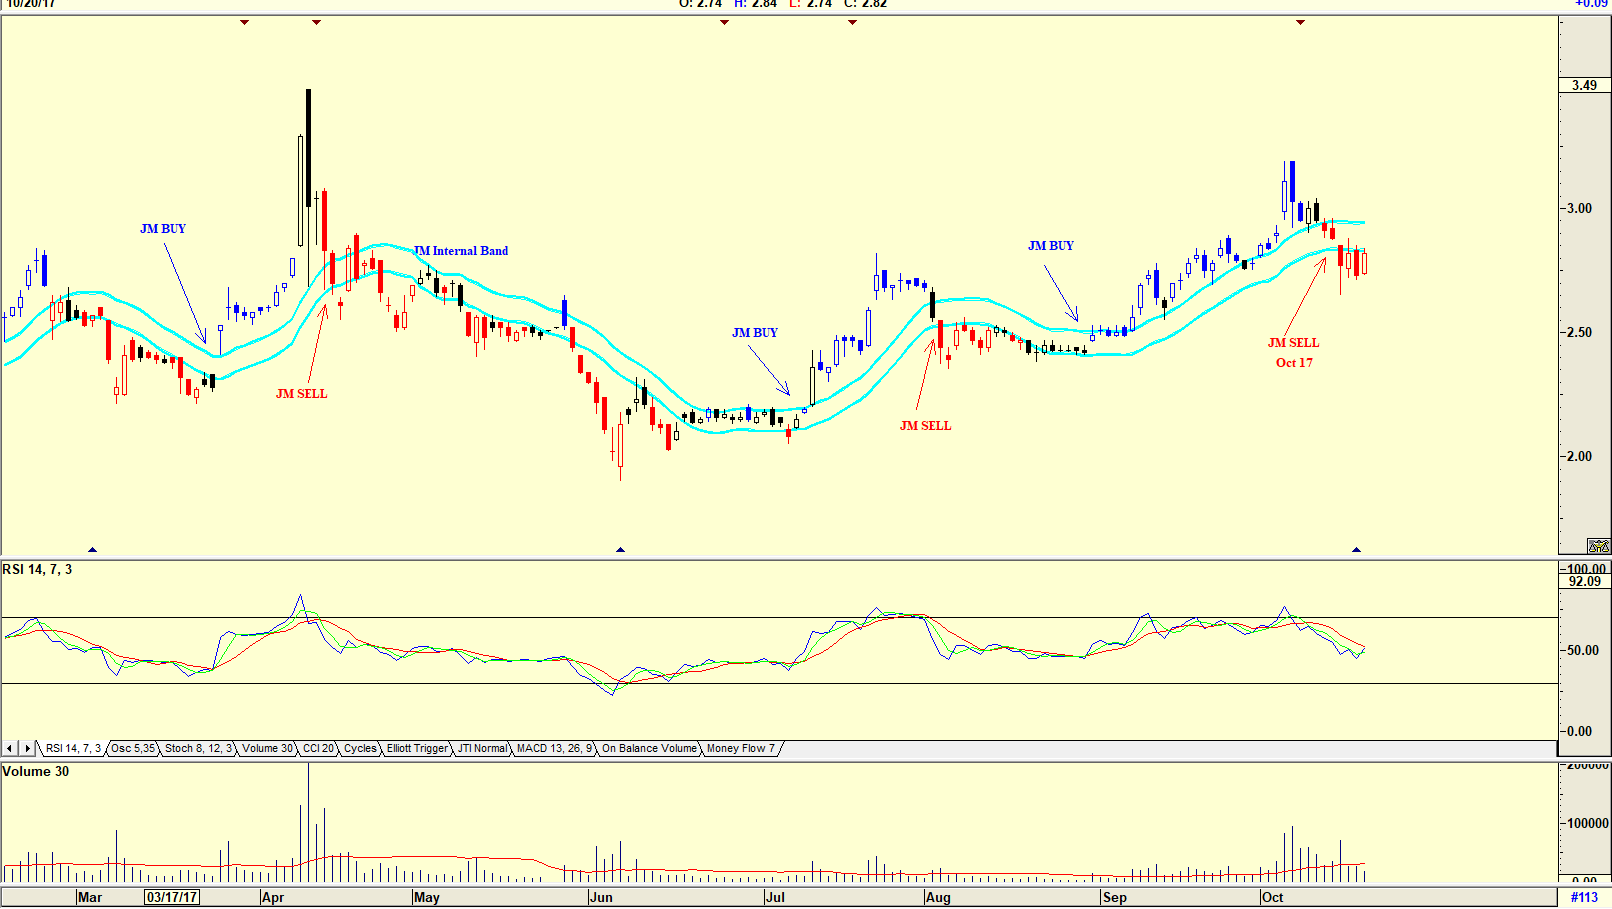
| The third pot share for your watch list is Aurora (ACB-T). Once again the share is in a JM Internal Band sell given on October 17. The share price fell on falling volume suggesting strength. The RSI Indicator also gave a sell, but looking at previous history, it could move into a buy mode by breaking above the moving average shown. |

|
| Figure 4. Canaopy Growth Corp. |
| Graphic provided by: AdvancedGET. |
| |
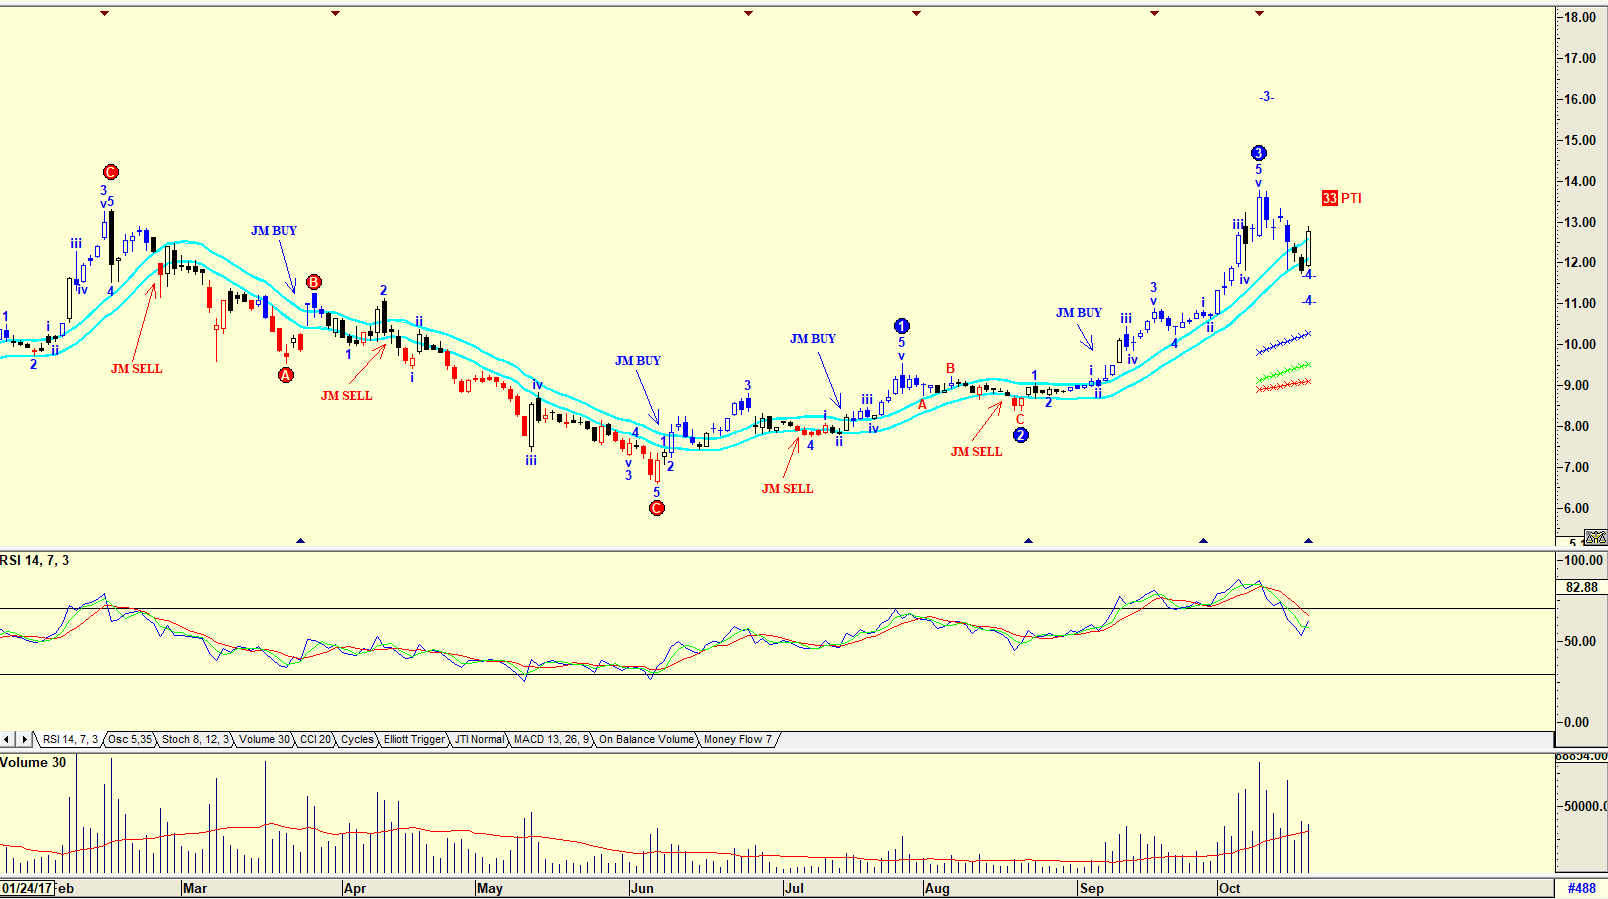
| The share in Figure 4 is Canopy Growth Corp with a ticker WEED-T identifying it as a Marijuana stock. The Elliott wave count shown on the chart suggests the share price is correcting in a WAVE 4 and could start rising in a WAVE 5. However, the PTI of 33 (Probability Index) is low. The RSI index is also trending down suggesting further weakness ahead. Yes, there are many more stocks on the Canadian market and US market that trade pot, and one can keep in a watch list. Legalization of marijuana in Canada is on the cards, with stores selling marijuana for medical purposes all over the country. |
Has been a technical analyst since 1969, and has worked as a futures and options trader with First Financial Futures in Johannesburg, South Africa.
| Address: | 3256 West 24th Ave |
| Vancouver, BC | |
| Phone # for sales: | 6042634214 |
| E-mail address: | petroosp@gmail.com |
Click here for more information about our publications!
PRINT THIS ARTICLE

Request Information From Our Sponsors
- StockCharts.com, Inc.
- Candle Patterns
- Candlestick Charting Explained
- Intermarket Technical Analysis
- John Murphy on Chart Analysis
- John Murphy's Chart Pattern Recognition
- John Murphy's Market Message
- MurphyExplainsMarketAnalysis-Intermarket Analysis
- MurphyExplainsMarketAnalysis-Visual Analysis
- StockCharts.com
- Technical Analysis of the Financial Markets
- The Visual Investor
- VectorVest, Inc.
- Executive Premier Workshop
- One-Day Options Course
- OptionsPro
- Retirement Income Workshop
- Sure-Fire Trading Systems (VectorVest, Inc.)
- Trading as a Business Workshop
- VectorVest 7 EOD
- VectorVest 7 RealTime/IntraDay
- VectorVest AutoTester
- VectorVest Educational Services
- VectorVest OnLine
- VectorVest Options Analyzer
- VectorVest ProGraphics v6.0
- VectorVest ProTrader 7
- VectorVest RealTime Derby Tool
- VectorVest Simulator
- VectorVest Variator
- VectorVest Watchdog
