

HOT TOPICS LIST
- MACD
- Fibonacci
- RSI
- Gann
- ADXR
- Stochastics
- Volume
- Triangles
- Futures
- Cycles
- Volatility
- ZIGZAG
- MESA
- Retracement
- Aroon
INDICATORS LIST
LIST OF TOPICS
PRINT THIS ARTICLE
by Stella Osoba, CMT
Sometimes we look at a chart and clearly see the trend. We wish we had only seen it earlier, when it had broken out from its basing pattern and begun its up/down trend. If only, we think, if only we had seen it when it was breaking out, we could have stayed with the trade as it rose effortlessly upwards. But is this actually the case? Even if we had been lucky and astute enough to spot the stock as it was breaking out of its basing pattern, would we have held onto the trade as it rose higher? Often not. We will explore some reasons why below.
Position: N/A
Stella Osoba, CMT
Stella Osoba is a trader and financial writer. She is a frequent contributor to "Technical Analysis of Stocks and Commodities" magazine and "Traders.com Advantage" as well as other financial publications.
PRINT THIS ARTICLE
TECHNICAL ANALYSIS
This Is What Makes Hindsight 20/20?
11/03/17 04:34:47 PMby Stella Osoba, CMT
Sometimes we look at a chart and clearly see the trend. We wish we had only seen it earlier, when it had broken out from its basing pattern and begun its up/down trend. If only, we think, if only we had seen it when it was breaking out, we could have stayed with the trade as it rose effortlessly upwards. But is this actually the case? Even if we had been lucky and astute enough to spot the stock as it was breaking out of its basing pattern, would we have held onto the trade as it rose higher? Often not. We will explore some reasons why below.
Position: N/A
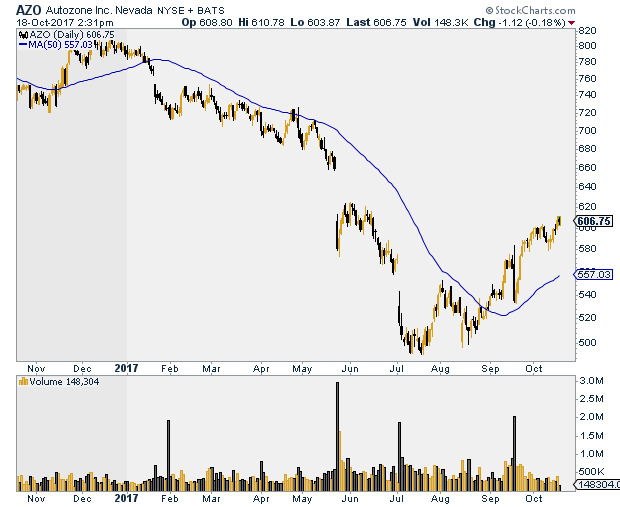
| When looking at historical charts, trends are often very easy to spot. But just because they are easy to spot does not make them easy to trade. We will use Autozone, Inc. (AZO) as an example of why profiting from a trade by staying with it can often be so difficult. |
| Figure 1 shows the daily price action of AZO. The chart clearly shows that the stock was in a downtrend for most of the past year. AZO reached a low of 492.02 on July 12, 2017. A week later on July 20, 2017, it made a slightly lower low of 491.30. The stock rose, but as it approached its 50-day moving average, it reacted and moved downwards again. The low reached on August 15, 2017 was 497.29. This was a good sign because, we reason, it is a higher low. So we watch to see what the stock will do next. |
|
| Figure 1. Daily chart for AZO showing recent uptrend. |
| Graphic provided by: StockCharts.com. |
| |
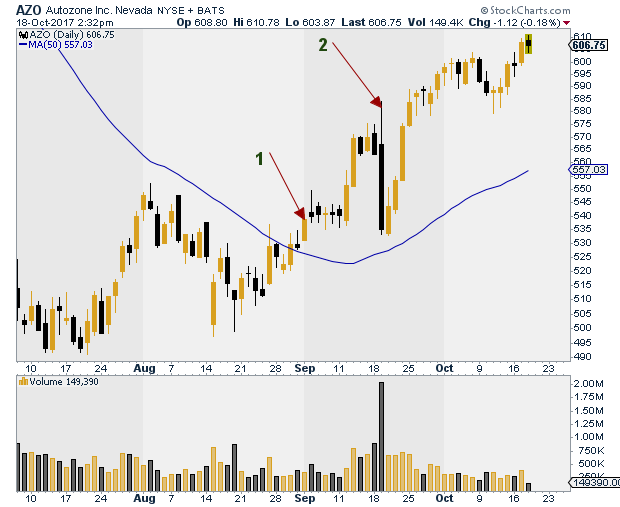
| The bears attempt to force the price down on August 18, 2017 is unsuccessful as the stock only reaches a low of 499.10. Even though the candle is bearish, the fact that its close is near its high and it has a long lower tail is bullish. If we had entered the trade on the break above the 50-day moving average (See 1 on Figure 2), the challenge would then be staying with the trade to take advantage of the uptrend. The day after you correctly entered the trade, a bearish bar formed, and for the next four days, price did not advance. The question is would you have stayed in the trade or gotten discouraged and exited? |
|
| Figure 2. Daily chart for AZO zoomed in on the recent uptrend. |
| Graphic provided by: StockCharts.com. |
| |
| If you did stay with the trade, you would have been rewarded, because on September 12, 2017, a strong bullish candle formed, advancing price. Another strong bullish candle the following day saw price close at 569.34. You now have a healthy profit. Price stalls for the next three days and then you watch in horror as price plunges on September 19, 2017 (See 2 on Figure 2). An exceptionally wide ranging day sees price move 50 points, plunging to close at 539.19. All our gains are now wiped out. Fearing further losses, do we exit the trade or hang on? |
| If we had hung on, we would likely now be standing on the sidelines watching as price advanced to close at 610 on October 18, 2017, or almost 100 points from our original entry. Trading is never as easy as hindsight makes it appear. There are tools we can use to help us determine whether to stay in a trade or exit to minimize losses. These will be explored in another article. |
Stella Osoba is a trader and financial writer. She is a frequent contributor to "Technical Analysis of Stocks and Commodities" magazine and "Traders.com Advantage" as well as other financial publications.
| E-mail address: | stellaosoba@gmail.com |
Click here for more information about our publications!
Comments
Date:�12/18/17Rank:�3Comment:�

Request Information From Our Sponsors
- VectorVest, Inc.
- Executive Premier Workshop
- One-Day Options Course
- OptionsPro
- Retirement Income Workshop
- Sure-Fire Trading Systems (VectorVest, Inc.)
- Trading as a Business Workshop
- VectorVest 7 EOD
- VectorVest 7 RealTime/IntraDay
- VectorVest AutoTester
- VectorVest Educational Services
- VectorVest OnLine
- VectorVest Options Analyzer
- VectorVest ProGraphics v6.0
- VectorVest ProTrader 7
- VectorVest RealTime Derby Tool
- VectorVest Simulator
- VectorVest Variator
- VectorVest Watchdog
- StockCharts.com, Inc.
- Candle Patterns
- Candlestick Charting Explained
- Intermarket Technical Analysis
- John Murphy on Chart Analysis
- John Murphy's Chart Pattern Recognition
- John Murphy's Market Message
- MurphyExplainsMarketAnalysis-Intermarket Analysis
- MurphyExplainsMarketAnalysis-Visual Analysis
- StockCharts.com
- Technical Analysis of the Financial Markets
- The Visual Investor