HOT TOPICS LIST
- MACD
- Fibonacci
- RSI
- Gann
- ADXR
- Stochastics
- Volume
- Triangles
- Futures
- Cycles
- Volatility
- ZIGZAG
- MESA
- Retracement
- Aroon
INDICATORS LIST
LIST OF TOPICS
PRINT THIS ARTICLE
by David Penn
A 1-2-3 Reversal and a 2B test of top both suggest that the rally in sugar is over.
Position: N/A
David Penn
Technical Writer for Technical Analysis of STOCKS & COMMODITIES magazine, Working-Money.com, and Traders.com Advantage.
PRINT THIS ARTICLE
REVERSAL
Two Takes on March Sugar's Top
12/09/02 10:59:31 AMby David Penn
A 1-2-3 Reversal and a 2B test of top both suggest that the rally in sugar is over.
Position: N/A
| Back in October, I noted that the March sugar futures contract appeared to be establishing a triple bottom ("March Sugar's Triple Bottom," October 4, 2002, Traders.com Advantage). This triple bottom was part of a seven-month, base-building period that lasted from February 2002 until the breakout early in September. The gains, post-breakout, were not insignificant for those who got long in September--to say nothing of those who bought during the last phases of the base-building period. Popping with a gap up move on September 9th on a close of 6.33, March sugar closed at 7.45 two months later in early November for a gain of more than 17% (approximately $1,250/per contract). |
| But with the sharp correction that took place shortly thereafter, suspicions undoubtedly grew about the staying power of the sugar rally. This was especially so given the fact that the minimum price target for the triple bottom--something in the neighborhood of 7.20--already had been reached in October. This suggested that while there may be more upside beyond the minimum target price, the risks of a sharp, profit-reducing correction were growing for those on the long side. |

|
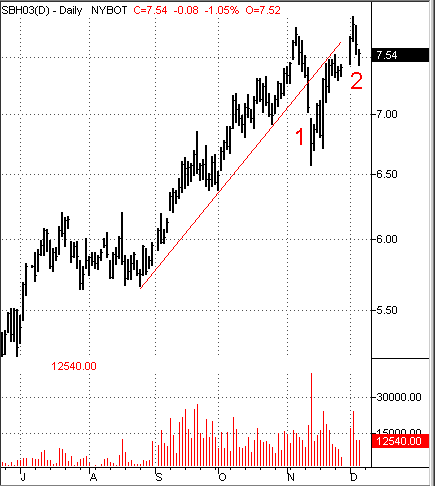
| Figure 1: A trendline break and failed follow through on the post-correction rally suggest lower prices for March sugar. |
| Graphic provided by: TradeStation. |
| |
| The definitive warning that the sugar rally was over came with the sizeable trendline break on November 12th. The follow through on the downside was even more pronounced, as March sugar gapped down on another wide-ranging day of high volatility. However, as I have suggested elsewhere, a good signal to close out a long position is not necessarily the same thing as a good signal to reverse and go short--particularly when the volatility is great. The case of March sugar in mid-November was an excellent example of why. One inside reversal day and March sugar was back in rally mode, bouncing back up from the correction lows in November to a new contract high within twelve trading days. |
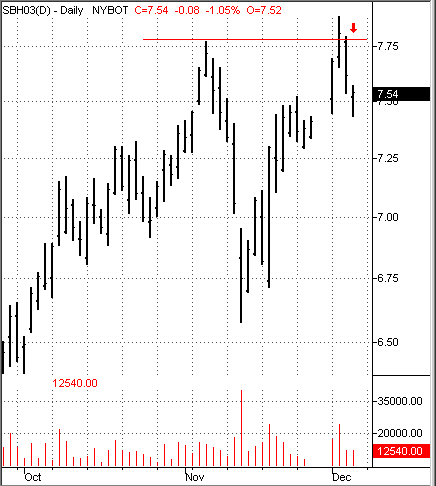
| Interestingly enough, however, this action--a rally that fails in the wake of a correction from a bull market--represents a far better scenario for taking a short position than simply chasing after prices that are already in collapse. Not only does the trendline break (1) and subsequent inability to follow through on the new high (2) set up a 1-2-3 Reversal entry on the short side, but also the inability to follow through on the new high ("new" vis-a-vis the previous new high on November 6th that immediately preceded the sharp, early November correction) represents a 2B test of top. The 2B test of top, which is effective in short, intermediate and long-term scenarios, is another helpful tool when trying to determine when a top has in fact been made. The test simply says that whenever a new high is superceded by a higher high, yet there is no immediate follow through, then the "higher high" is suspect and the aggressive trader is encouraged to take a short position, with a buy-stop just above the "higher high." |
 Figure 2: A new contract high in December, but no upside follow through does not bode well for further, near-term advances in sugar. One of the other reasons why this setup provides a good risk/reward scenario is that a relatively small move to the upside--such as a new contract high with bullish follow through--would both invalidate the basis for the short trade as well as get the trader out of the position with a comparatively small loss. On the reward side, even if March sugar found support at the November correction low of 6.57, the aggressive short position initiated in the 7.50 area would still be quite a profitable trade. This is compared to a more "simplistic" chart pattern approach that might call for waiting on a developing "double top" or "head and shoulders top" to break down at 6.57. Following such a methodology here would expose the trader to the risk that the consolidation from July and August would limit any meaningful move below support at 6.37. |
Technical Writer for Technical Analysis of STOCKS & COMMODITIES magazine, Working-Money.com, and Traders.com Advantage.
| Title: | Technical Writer |
| Company: | Technical Analysis, Inc. |
| Address: | 4757 California Avenue SW |
| Seattle, WA 98116 | |
| Phone # for sales: | 206 938 0570 |
| Fax: | 206 938 1307 |
| Website: | www.Traders.com |
| E-mail address: | DPenn@traders.com |
Traders' Resource Links | |
| Charting the Stock Market: The Wyckoff Method -- Books | |
| Working-Money.com -- Online Trading Services | |
| Traders.com Advantage -- Online Trading Services | |
| Technical Analysis of Stocks & Commodities -- Publications and Newsletters | |
| Working Money, at Working-Money.com -- Publications and Newsletters | |
| Traders.com Advantage -- Publications and Newsletters | |
| Professional Traders Starter Kit -- Software | |
Click here for more information about our publications!
Comments

Request Information From Our Sponsors
- StockCharts.com, Inc.
- Candle Patterns
- Candlestick Charting Explained
- Intermarket Technical Analysis
- John Murphy on Chart Analysis
- John Murphy's Chart Pattern Recognition
- John Murphy's Market Message
- MurphyExplainsMarketAnalysis-Intermarket Analysis
- MurphyExplainsMarketAnalysis-Visual Analysis
- StockCharts.com
- Technical Analysis of the Financial Markets
- The Visual Investor
- VectorVest, Inc.
- Executive Premier Workshop
- One-Day Options Course
- OptionsPro
- Retirement Income Workshop
- Sure-Fire Trading Systems (VectorVest, Inc.)
- Trading as a Business Workshop
- VectorVest 7 EOD
- VectorVest 7 RealTime/IntraDay
- VectorVest AutoTester
- VectorVest Educational Services
- VectorVest OnLine
- VectorVest Options Analyzer
- VectorVest ProGraphics v6.0
- VectorVest ProTrader 7
- VectorVest RealTime Derby Tool
- VectorVest Simulator
- VectorVest Variator
- VectorVest Watchdog
