HOT TOPICS LIST
- MACD
- Fibonacci
- RSI
- Gann
- ADXR
- Stochastics
- Volume
- Triangles
- Futures
- Cycles
- Volatility
- ZIGZAG
- MESA
- Retracement
- Aroon
INDICATORS LIST
LIST OF TOPICS
PRINT THIS ARTICLE
by Koos van der Merwe
Buying a share and holding forever can be an advantage, but do watch out for a correction.
Position: Sell
Koos van der Merwe
Has been a technical analyst since 1969, and has worked as a futures and options trader with First Financial Futures in Johannesburg, South Africa.
PRINT THIS ARTICLE
TECHNICAL ANALYSIS
A Share Worth Watching
10/26/17 02:10:41 PMby Koos van der Merwe
Buying a share and holding forever can be an advantage, but do watch out for a correction.
Position: Sell
| Shares of VISA have been rated by Wells Fargo as outperform. The company has delivered eye-popping returns for investors, having quadrupled in price over the past six years. This year, so far, the stock is up another 35%. Since going public, shares of VISA have beaten earnings expectations 36 out of 38 quarters. What for the future? |

|
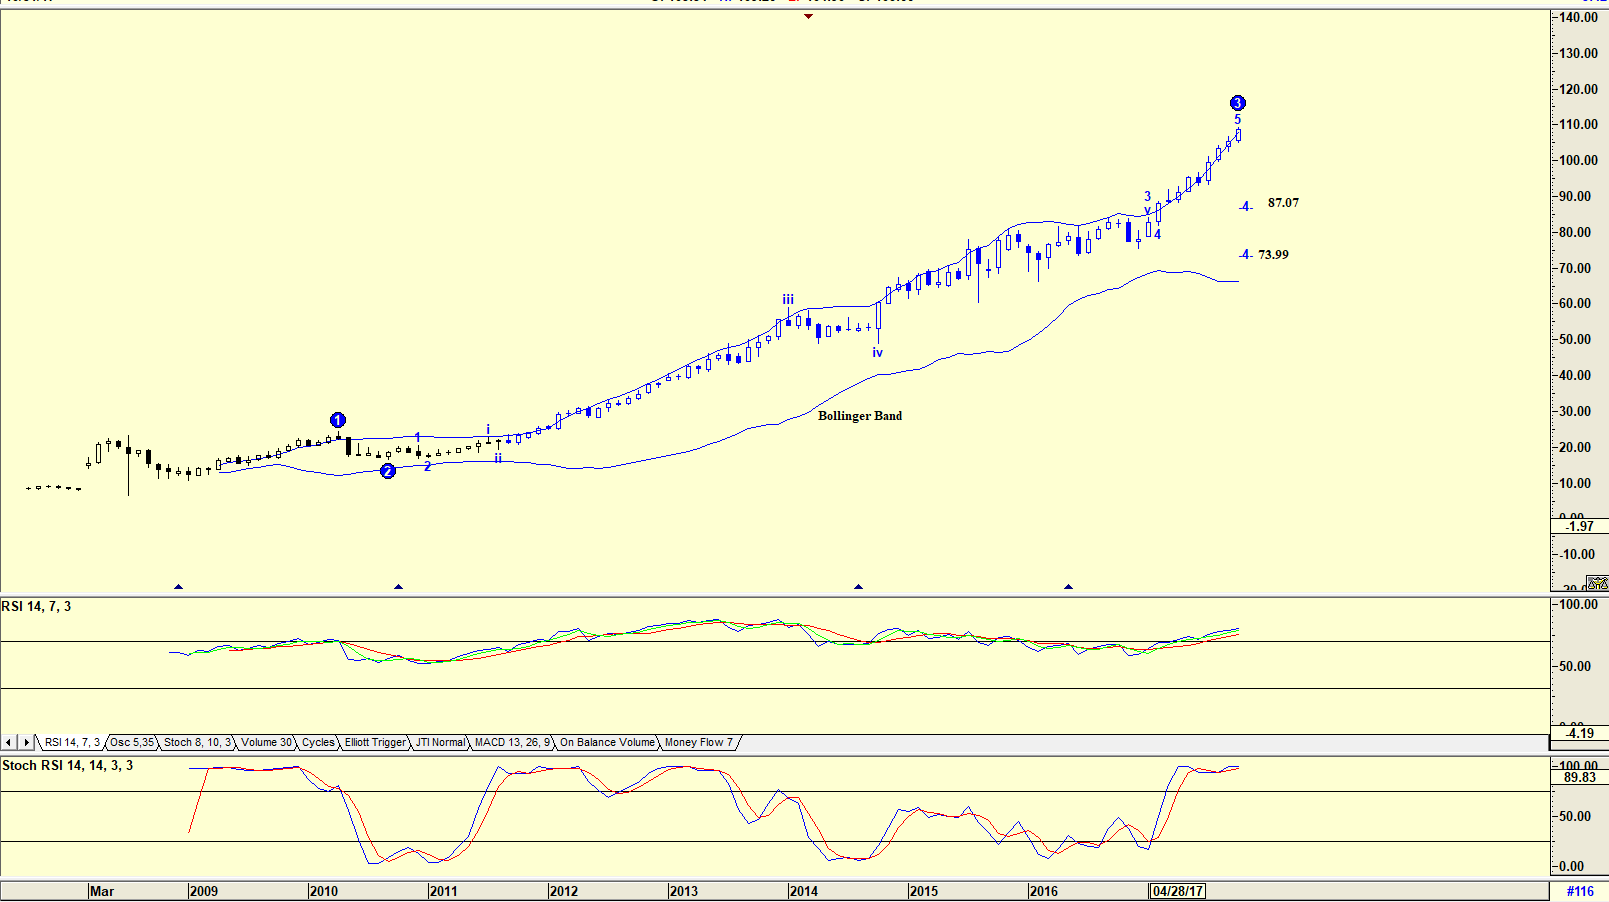
| Figure 1. Monthly chart with an Elliott wave count. |
| Graphic provided by: AdvancedGET. |
| |
| The chart in Figure 1 is a monthly chart with an Elliott wave count suggesting that the share price should fall in a WAVE 4 to either $87.07 or $73.99. The share price has been testing the upper Bollinger Band almost forever, with an RSI at overbought levels. The Stochastic RSI indicator is presently at overbought levels, suggesting that a correction could occur soon. |

|
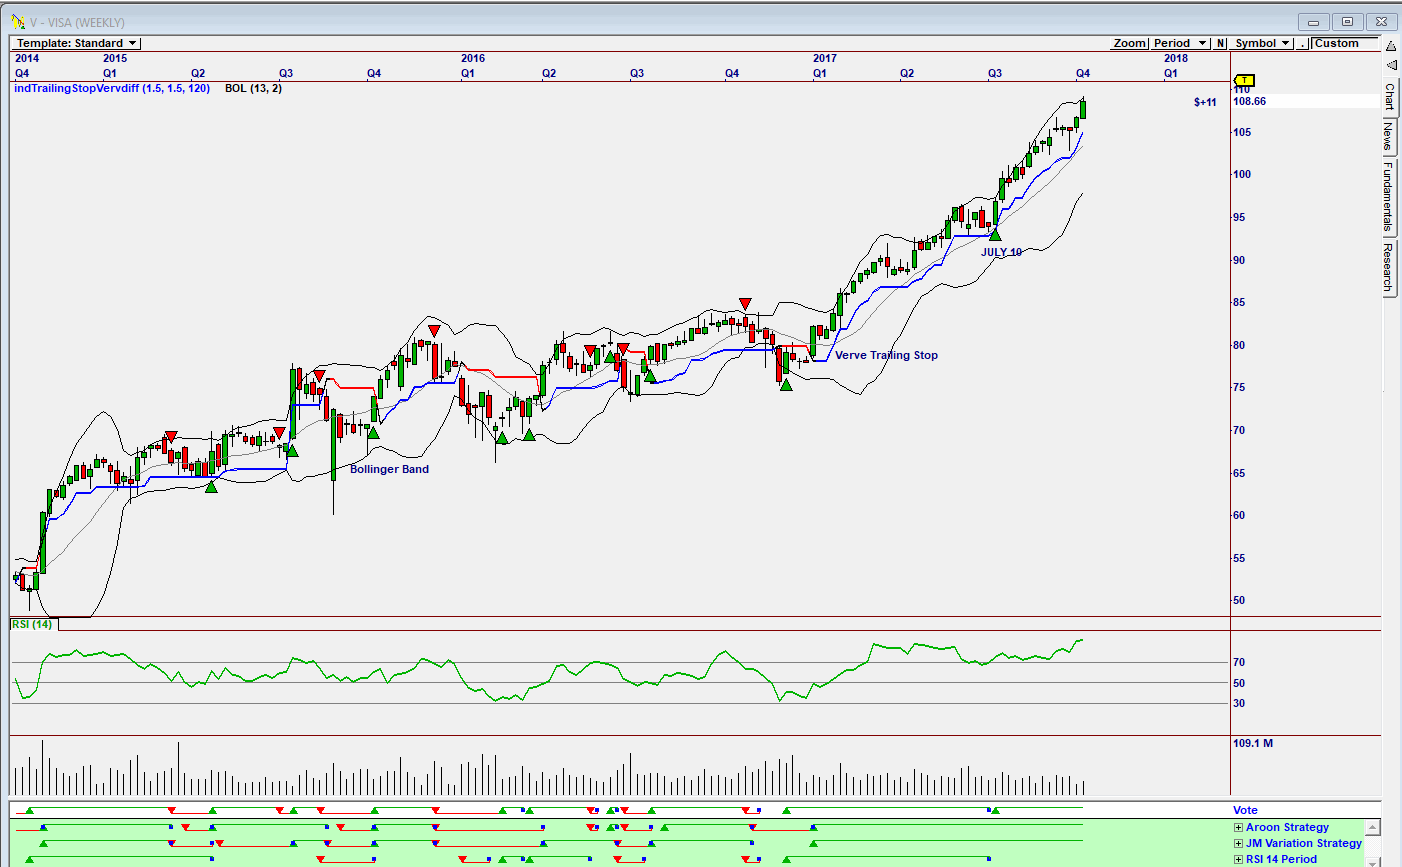
| Figure 2. Weekly Omnitrader chart showing buy signal. |
| Graphic provided by: Omnitrader. |
| |
| The weekly Omnitrader chart shown in Figure 2 has a Vote line suggesting a hold after a buy was given on July 10, based on buy signals given buy the Aroon Strategy and JM Variation Strategy. The RSI indicator is at overbought levels, but not suggesting a sell. Volume has fallen slightly but is not suggesting a sell. A rising price with rising volume equals strength. |

|
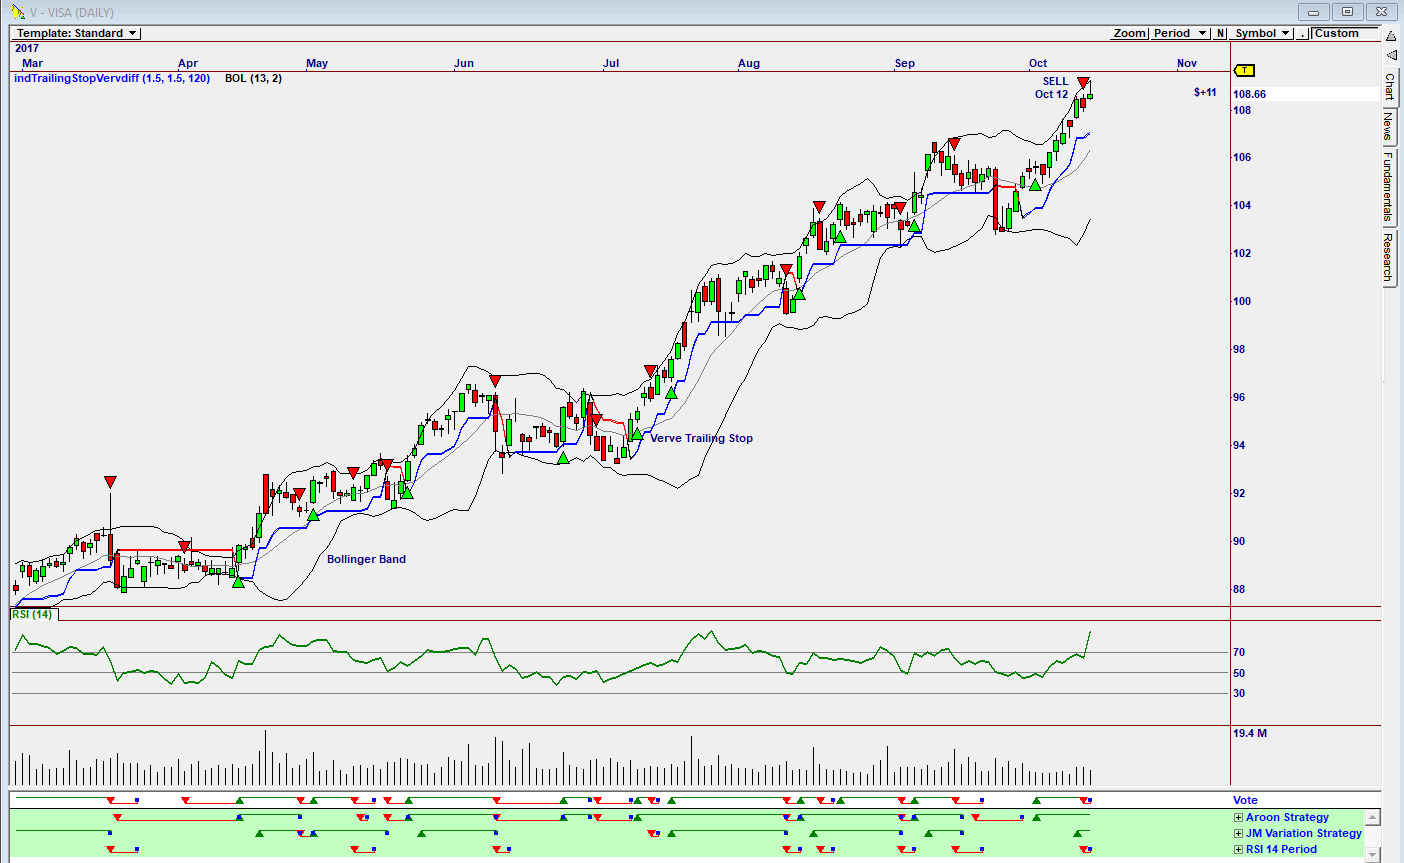
| Figure 3. Daily Omnitrader Chart. |
| Graphic provided by: Omnitrader. |
| |
| The daily chart shows that a sell signal was suggested on October 12 based on The RSI 14-Period Strategy, however because both the Aroon Strategy and JM Variation Strategy are in buy mode the sell signal was stopped out on October 13 suggesting the share could still be a good buy. VISA is a share one could buy and hold for the long term. With so many advisors calling for caution in the market, "wait and see" could be the strategy to follow. The correction suggested by the monthly chart could be the way to go at the moment. |
Has been a technical analyst since 1969, and has worked as a futures and options trader with First Financial Futures in Johannesburg, South Africa.
| Address: | 3256 West 24th Ave |
| Vancouver, BC | |
| Phone # for sales: | 6042634214 |
| E-mail address: | petroosp@gmail.com |
Click here for more information about our publications!
Comments
Date: 11/03/17Rank: 5Comment:

Request Information From Our Sponsors
- StockCharts.com, Inc.
- Candle Patterns
- Candlestick Charting Explained
- Intermarket Technical Analysis
- John Murphy on Chart Analysis
- John Murphy's Chart Pattern Recognition
- John Murphy's Market Message
- MurphyExplainsMarketAnalysis-Intermarket Analysis
- MurphyExplainsMarketAnalysis-Visual Analysis
- StockCharts.com
- Technical Analysis of the Financial Markets
- The Visual Investor
- VectorVest, Inc.
- Executive Premier Workshop
- One-Day Options Course
- OptionsPro
- Retirement Income Workshop
- Sure-Fire Trading Systems (VectorVest, Inc.)
- Trading as a Business Workshop
- VectorVest 7 EOD
- VectorVest 7 RealTime/IntraDay
- VectorVest AutoTester
- VectorVest Educational Services
- VectorVest OnLine
- VectorVest Options Analyzer
- VectorVest ProGraphics v6.0
- VectorVest ProTrader 7
- VectorVest RealTime Derby Tool
- VectorVest Simulator
- VectorVest Variator
- VectorVest Watchdog
